| Red | Green | Blue | |
| z | 17.64 | ||
| znorm | Inf | ||
| sky | -Inf | -Inf | -Inf |
| S/N | 29.2 | 49.0 | 57.1 |
| S/N(c) | 0.0 | 0.0 | 0.0 |
| SN(E/C) |
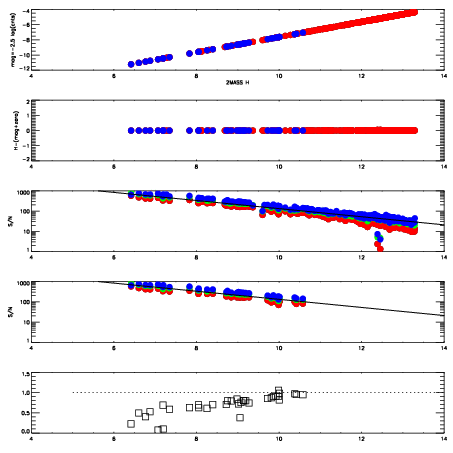
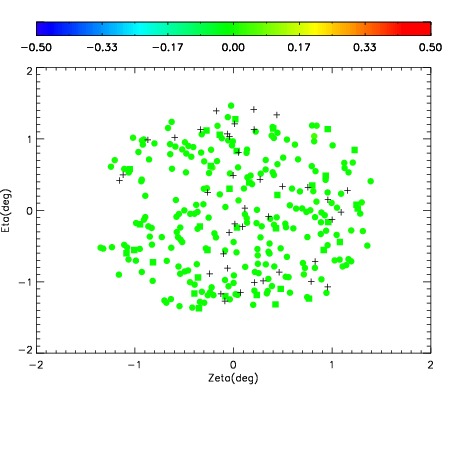
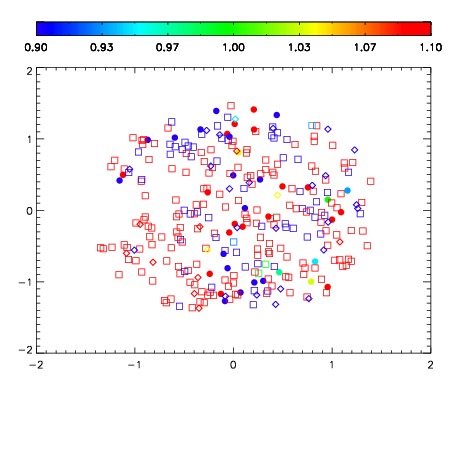


| Frame | Nreads | Zeropoints | Mag plots | Spatial mag deviation | Spatial sky 16325A emission deviations (filled: sky, open: star) | Spatial sky continuum emission | Spatial sky telluric CO2 absorption deviations (filled: H < 10) | |||||||||||||||||||||||
| 0 | 0 |
|
|
|
|
|
|
| IPAIR | NAME | SHIFT | NEWSHIFT | S/N | NAME | SHIFT | NEWSHIFT | S/N |
| 0 | 06940043 | 0.495552 | 0.00000 | 217.401 | 06940045 | -0.00304464 | 0.498597 | 209.096 |
| 1 | 06940038 | 0.493828 | 0.00172400 | 232.759 | 06940037 | 0.00000 | 0.495552 | 232.528 |
| 2 | 06940039 | 0.494674 | 0.000878006 | 229.433 | 06940040 | -0.000875132 | 0.496427 | 230.516 |
| 3 | 06940042 | 0.494982 | 0.000569999 | 224.223 | 06940041 | -0.00118751 | 0.496740 | 229.578 |
| 4 | 06940046 | 0.494088 | 0.00146401 | 218.393 | 06940044 | -0.00126582 | 0.496818 | 221.638 |