| Red | Green | Blue | |
| z | 17.64 | ||
| znorm | Inf | ||
| sky | -Inf | -Inf | -Inf |
| S/N | 25.0 | 43.5 | 49.7 |
| S/N(c) | 0.0 | 0.0 | 0.0 |
| SN(E/C) |


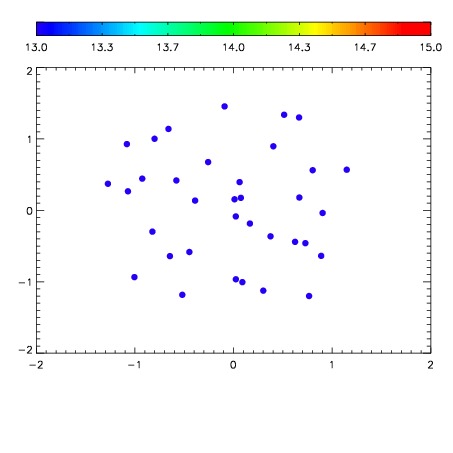

| Frame | Nreads | Zeropoints | Mag plots | Spatial mag deviation | Spatial sky 16325A emission deviations (filled: sky, open: star) | Spatial sky continuum emission | Spatial sky telluric CO2 absorption deviations (filled: H < 10) | |||||||||||||||||||||||
| 0 | 0 |
|
|
|
|
|
|
| IPAIR | NAME | SHIFT | NEWSHIFT | S/N | NAME | SHIFT | NEWSHIFT | S/N |
| 0 | 06630062 | 0.487314 | 0.00000 | 211.587 | 06630060 | 0.00241716 | 0.484897 | 209.806 |
| 1 | 06630058 | 0.483867 | 0.00344700 | 212.041 | 06630056 | 0.00000 | 0.487314 | 212.472 |
| 2 | 06630061 | 0.486106 | 0.00120798 | 208.773 | 06630063 | 0.00368710 | 0.483627 | 208.642 |
| 3 | 06630057 | 0.483244 | 0.00406998 | 206.852 | 06630059 | 0.00449106 | 0.482823 | 203.837 |