| Red | Green | Blue | |
| z | 17.64 | ||
| znorm | Inf | ||
| sky | -Inf | -NaN | -Inf |
| S/N | 31.2 | 51.6 | 58.0 |
| S/N(c) | 0.0 | 0.0 | 0.0 |
| SN(E/C) |
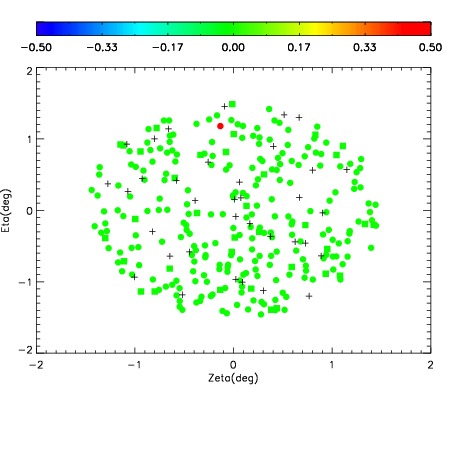
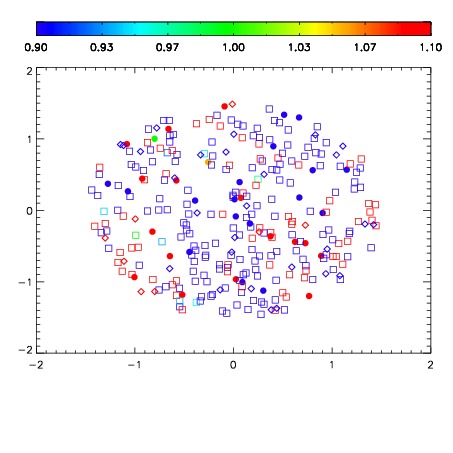
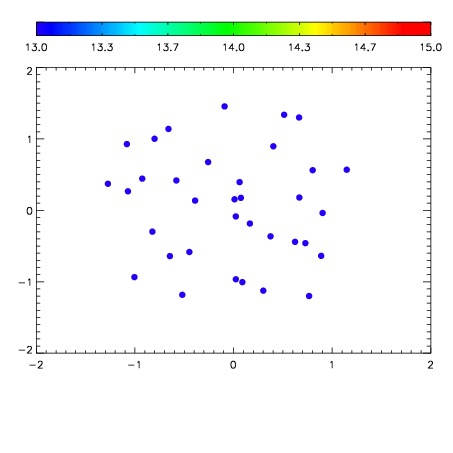

| Frame | Nreads | Zeropoints | Mag plots | Spatial mag deviation | Spatial sky 16325A emission deviations (filled: sky, open: star) | Spatial sky continuum emission | Spatial sky telluric CO2 absorption deviations (filled: H < 10) | |||||||||||||||||||||||
| 0 | 0 |
|
|
|
|
|
|
| IPAIR | NAME | SHIFT | NEWSHIFT | S/N | NAME | SHIFT | NEWSHIFT | S/N |
| 0 | 06730039 | 0.493712 | 0.00000 | 236.204 | 06730041 | 0.000596416 | 0.493116 | 238.691 |
| 1 | 06730043 | 0.492582 | 0.00113001 | 240.265 | 06730044 | 0.000783633 | 0.492928 | 240.627 |
| 2 | 06730042 | 0.490485 | 0.00322700 | 238.605 | 06730040 | 0.000426815 | 0.493285 | 238.818 |
| 3 | 06730038 | 0.490992 | 0.00272000 | 236.137 | 06730037 | 0.00000 | 0.493712 | 233.998 |