| Red | Green | Blue | |
| z | 17.64 | ||
| znorm | Inf | ||
| sky | -Inf | -Inf | -Inf |
| S/N | 29.8 | 50.7 | 55.9 |
| S/N(c) | 0.0 | 0.0 | 0.0 |
| SN(E/C) |
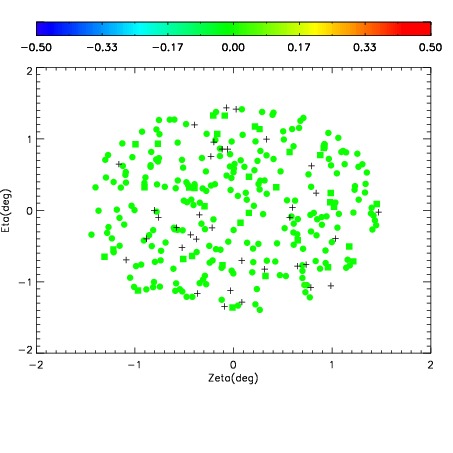
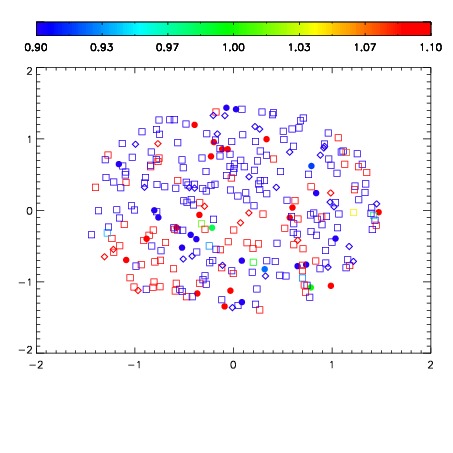
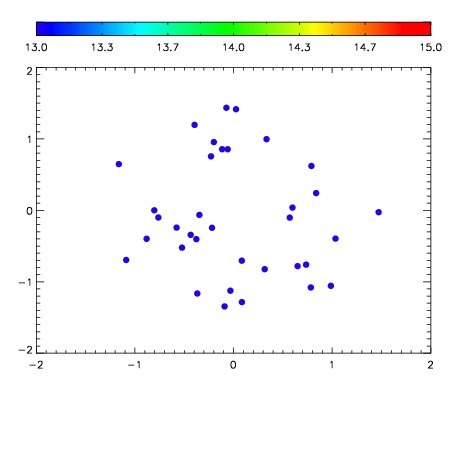

| Frame | Nreads | Zeropoints | Mag plots | Spatial mag deviation | Spatial sky 16325A emission deviations (filled: sky, open: star) | Spatial sky continuum emission | Spatial sky telluric CO2 absorption deviations (filled: H < 10) | |||||||||||||||||||||||
| 0 | 0 |
|
|
|
|
|
|
| IPAIR | NAME | SHIFT | NEWSHIFT | S/N | NAME | SHIFT | NEWSHIFT | S/N |
| 0 | 06440050 | 0.467758 | 0.00000 | 230.005 | 06440048 | 0.00000 | 0.467758 | 228.986 |
| 1 | 06440053 | 0.465626 | 0.00213200 | 230.078 | 06440052 | -0.00318124 | 0.470939 | 229.509 |
| 2 | 06440049 | 0.466998 | 0.000759989 | 228.969 | 06440051 | -0.00137614 | 0.469134 | 227.487 |
| 3 | 06440054 | 0.466465 | 0.00129300 | 227.984 | 06440055 | -0.00228036 | 0.470038 | 226.804 |