| Red | Green | Blue | |
| z | 17.64 | ||
| znorm | Inf | ||
| sky | -Inf | -Inf | -Inf |
| S/N | 27.3 | 47.2 | 51.8 |
| S/N(c) | 0.0 | 0.0 | 0.0 |
| SN(E/C) |


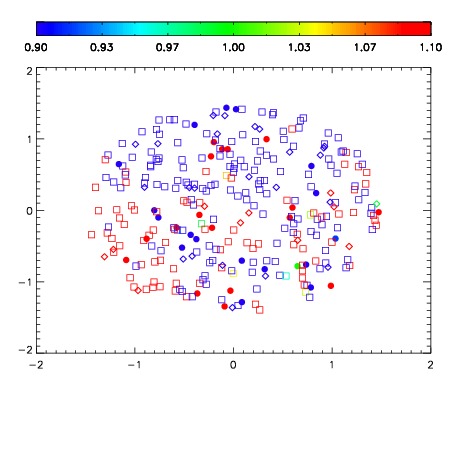
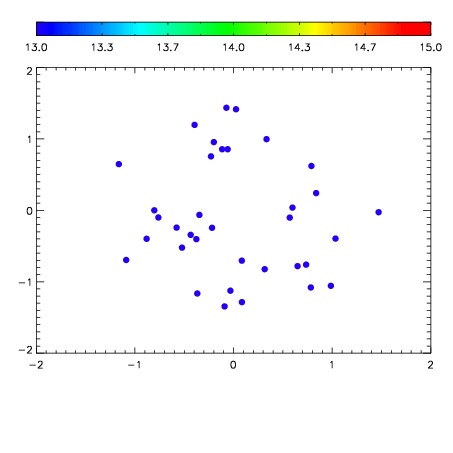

| Frame | Nreads | Zeropoints | Mag plots | Spatial mag deviation | Spatial sky 16325A emission deviations (filled: sky, open: star) | Spatial sky continuum emission | Spatial sky telluric CO2 absorption deviations (filled: H < 10) | |||||||||||||||||||||||
| 0 | 0 |
|
|
|
|
|
|
| IPAIR | NAME | SHIFT | NEWSHIFT | S/N | NAME | SHIFT | NEWSHIFT | S/N |
| 0 | 06670076 | 0.474489 | 0.00000 | 215.926 | 06670077 | -0.00128070 | 0.475770 | 195.640 |
| 1 | 06670072 | 0.472448 | 0.00204101 | 224.069 | 06670070 | 0.00000 | 0.474489 | 223.207 |
| 2 | 06670075 | 0.473830 | 0.000658989 | 219.141 | 06670073 | -0.000387468 | 0.474876 | 222.435 |
| 3 | 06670071 | 0.472264 | 0.00222501 | 216.801 | 06670074 | -0.000906288 | 0.475395 | 220.514 |