| Red | Green | Blue | |
| z | 17.64 | ||
| znorm | Inf | ||
| sky | -Inf | -Inf | -Inf |
| S/N | 28.9 | 49.1 | 56.7 |
| S/N(c) | 0.0 | 0.0 | 0.0 |
| SN(E/C) |
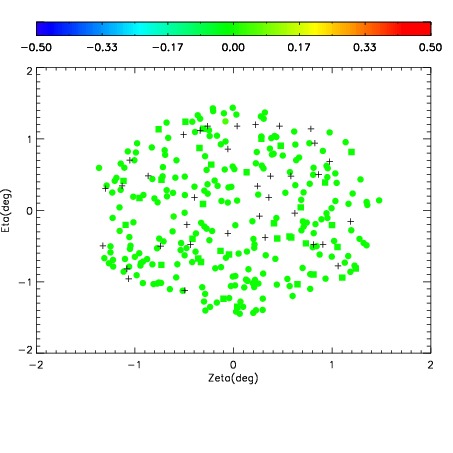
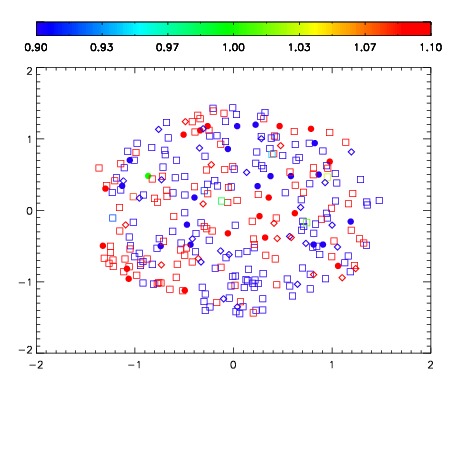
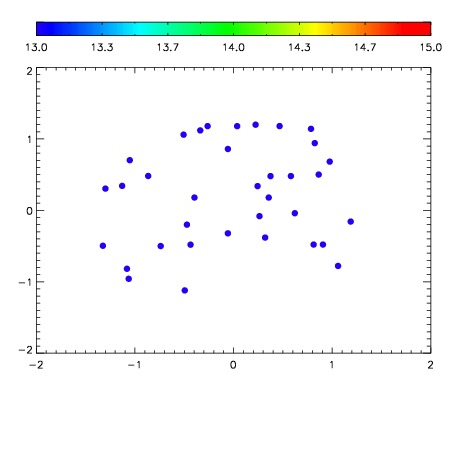

| Frame | Nreads | Zeropoints | Mag plots | Spatial mag deviation | Spatial sky 16325A emission deviations (filled: sky, open: star) | Spatial sky continuum emission | Spatial sky telluric CO2 absorption deviations (filled: H < 10) | |||||||||||||||||||||||
| 0 | 0 |
|
|
|
|
|
|
| IPAIR | NAME | SHIFT | NEWSHIFT | S/N | NAME | SHIFT | NEWSHIFT | S/N |
| 0 | 06970063 | 0.487219 | 0.00000 | 195.844 | 06970061 | 0.00000 | 0.487219 | 194.731 |
| 1 | 06970067 | 0.486095 | 0.00112399 | 201.161 | 06970068 | -0.00154228 | 0.488761 | 201.902 |
| 2 | 06970066 | 0.484445 | 0.00277400 | 200.678 | 06970064 | -2.89861e-05 | 0.487248 | 198.095 |
| 3 | 06970062 | 0.486296 | 0.000923008 | 194.119 | 06970065 | -0.00115806 | 0.488377 | 193.476 |