| Red | Green | Blue | |
| z | 17.64 | ||
| znorm | Inf | ||
| sky | -Inf | -Inf | -Inf |
| S/N | 20.1 | 35.6 | 39.7 |
| S/N(c) | 0.0 | 0.0 | 0.0 |
| SN(E/C) |
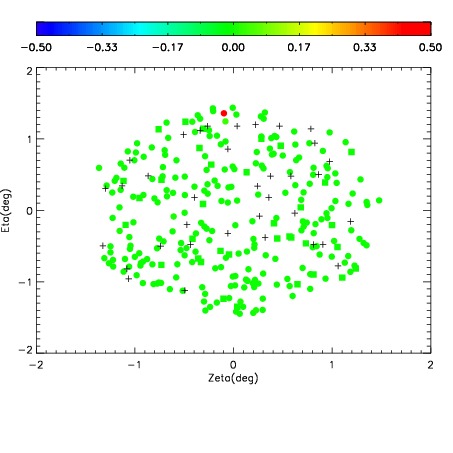
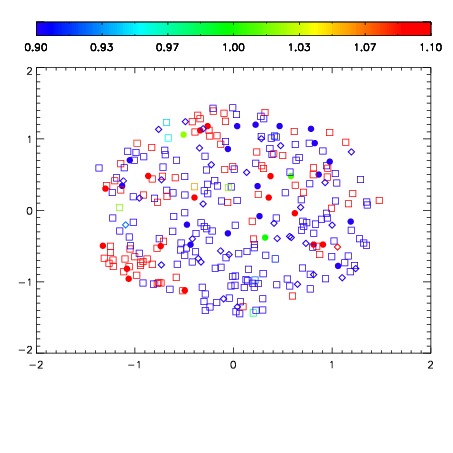
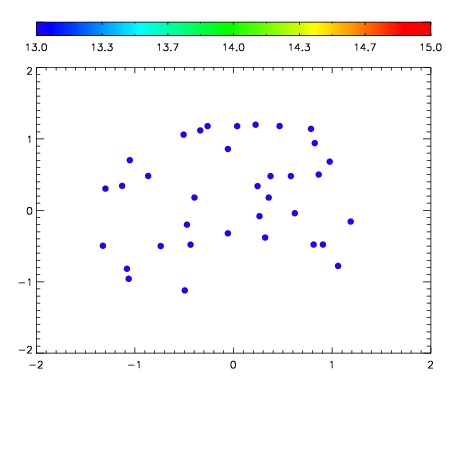

| Frame | Nreads | Zeropoints | Mag plots | Spatial mag deviation | Spatial sky 16325A emission deviations (filled: sky, open: star) | Spatial sky continuum emission | Spatial sky telluric CO2 absorption deviations (filled: H < 10) | |||||||||||||||||||||||
| 0 | 0 |
|
|
|
|
|
|
| IPAIR | NAME | SHIFT | NEWSHIFT | S/N | NAME | SHIFT | NEWSHIFT | S/N |
| 0 | 07040028 | 0.469430 | 0.00000 | 174.214 | 07040026 | 0.00000 | 0.469430 | 180.358 |
| 1 | 07040027 | 0.468273 | 0.00115699 | 174.139 | 07040029 | -0.00158169 | 0.471012 | 162.406 |
| 2 | 07040031 | 0.466681 | 0.00274900 | 144.475 | 07040030 | 0.000957491 | 0.468473 | 151.803 |
| 3 | 07040032 | 0.467482 | 0.00194800 | 137.319 | 07040033 | -0.000120015 | 0.469550 | 146.136 |