| Red | Green | Blue | |
| z | 17.64 | ||
| znorm | Inf | ||
| sky | -Inf | -Inf | -Inf |
| S/N | 34.1 | 59.8 | 65.6 |
| S/N(c) | 0.0 | 0.0 | 0.0 |
| SN(E/C) |
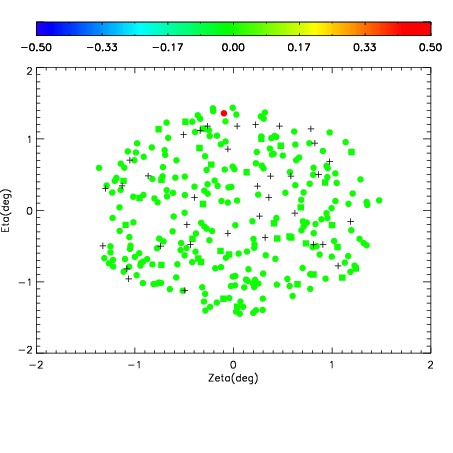
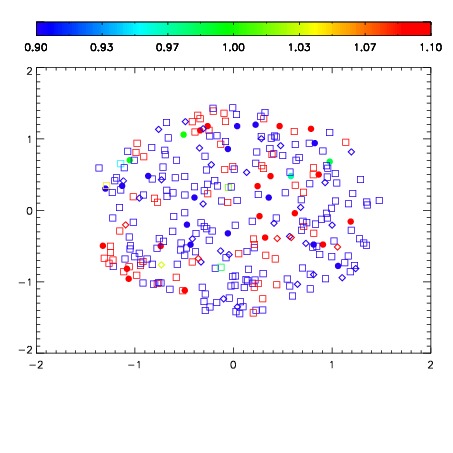
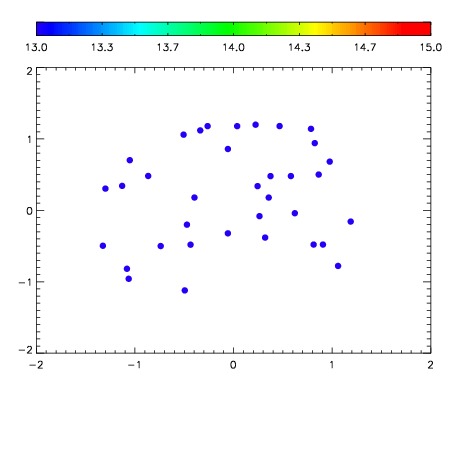

| Frame | Nreads | Zeropoints | Mag plots | Spatial mag deviation | Spatial sky 16325A emission deviations (filled: sky, open: star) | Spatial sky continuum emission | Spatial sky telluric CO2 absorption deviations (filled: H < 10) | |||||||||||||||||||||||
| 0 | 0 |
|
|
|
|
|
|
| IPAIR | NAME | SHIFT | NEWSHIFT | S/N | NAME | SHIFT | NEWSHIFT | S/N |
| 0 | 07230069 | 0.474225 | 0.00000 | 210.946 | 07230066 | -0.000582078 | 0.474807 | 212.734 |
| 1 | 07230065 | 0.471698 | 0.00252703 | 211.043 | 07230067 | 0.00217380 | 0.472051 | 213.011 |
| 2 | 07230068 | 0.473329 | 0.000896007 | 207.521 | 07230063 | 0.00220644 | 0.472019 | 210.900 |
| 3 | 07230061 | 0.472155 | 0.00207001 | 207.463 | 07230062 | 0.00395656 | 0.470268 | 204.936 |
| 4 | 07230064 | 0.471581 | 0.00264400 | 206.782 | 07230070 | 0.00452247 | 0.469703 | 200.217 |
| 5 | 07230060 | 0.472269 | 0.00195602 | 197.485 | 07230059 | 0.00000 | 0.474225 | 188.660 |