| Red | Green | Blue | |
| z | 17.64 | ||
| znorm | Inf | ||
| sky | -Inf | -Inf | -Inf |
| S/N | 27.4 | 46.3 | 53.0 |
| S/N(c) | 0.0 | 0.0 | 0.0 |
| SN(E/C) |
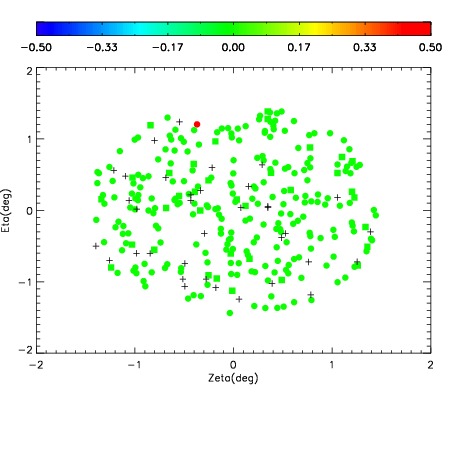
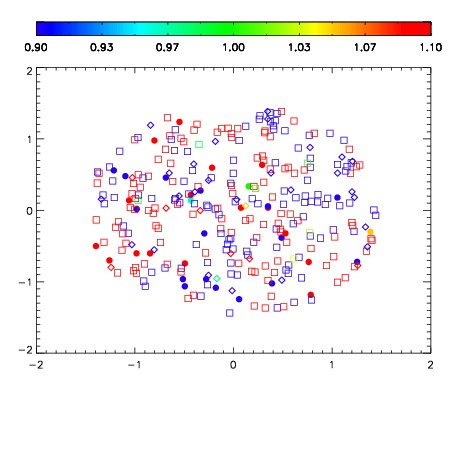
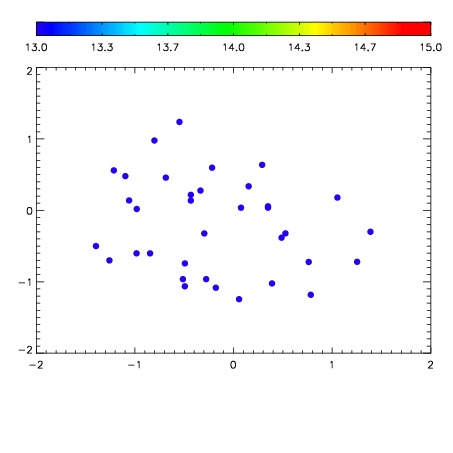

| Frame | Nreads | Zeropoints | Mag plots | Spatial mag deviation | Spatial sky 16325A emission deviations (filled: sky, open: star) | Spatial sky continuum emission | Spatial sky telluric CO2 absorption deviations (filled: H < 10) | |||||||||||||||||||||||
| 0 | 0 |
|
|
|
|
|
|
| IPAIR | NAME | SHIFT | NEWSHIFT | S/N | NAME | SHIFT | NEWSHIFT | S/N |
| 0 | 06950073 | 0.497085 | 0.00000 | 252.929 | 06950075 | -0.00367094 | 0.500756 | 253.549 |
| 1 | 06950076 | 0.493152 | 0.00393301 | 252.276 | 06950074 | -0.000835024 | 0.497920 | 253.411 |
| 2 | 06950072 | 0.496871 | 0.000214010 | 249.755 | 06950071 | 0.00000 | 0.497085 | 247.520 |
| 3 | 06950077 | 0.493637 | 0.00344801 | 243.795 | 06950078 | -0.000418608 | 0.497504 | 242.409 |