| Red | Green | Blue | |
| z | 17.64 | ||
| znorm | Inf | ||
| sky | -Inf | -Inf | -Inf |
| S/N | 26.0 | 43.3 | 50.7 |
| S/N(c) | 0.0 | 0.0 | 0.0 |
| SN(E/C) |
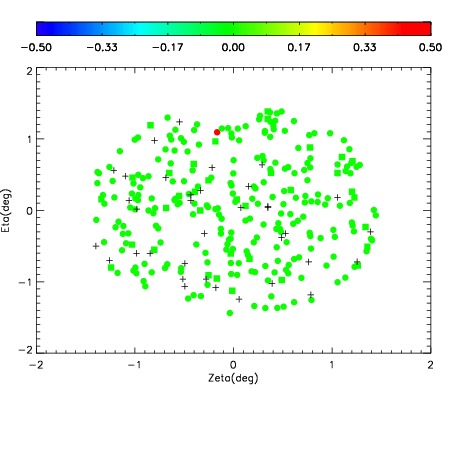
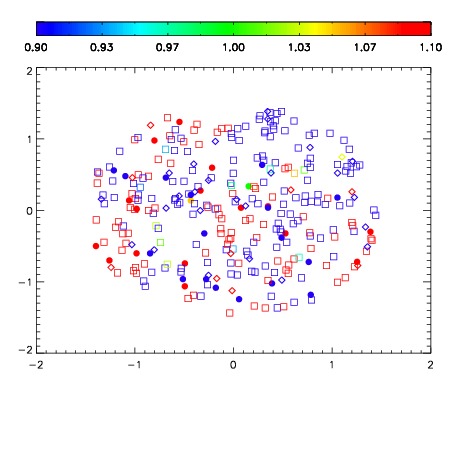
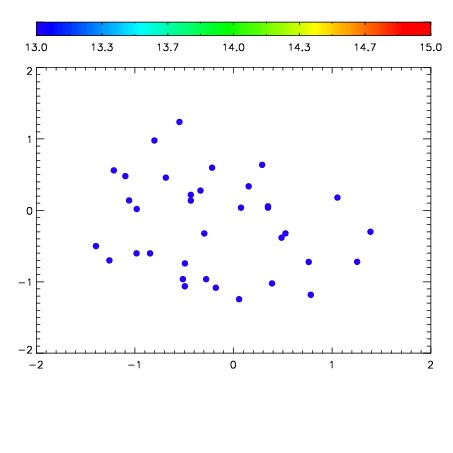

| Frame | Nreads | Zeropoints | Mag plots | Spatial mag deviation | Spatial sky 16325A emission deviations (filled: sky, open: star) | Spatial sky continuum emission | Spatial sky telluric CO2 absorption deviations (filled: H < 10) | |||||||||||||||||||||||
| 0 | 0 |
|
|
|
|
|
|
| IPAIR | NAME | SHIFT | NEWSHIFT | S/N | NAME | SHIFT | NEWSHIFT | S/N |
| 0 | 07030038 | 0.468072 | 0.00000 | 226.821 | 07030036 | 0.00000 | 0.468072 | 229.548 |
| 1 | 07030042 | 0.467676 | 0.000395983 | 236.194 | 07030043 | -0.000870016 | 0.468942 | 229.984 |
| 2 | 07030041 | 0.467016 | 0.00105599 | 232.422 | 07030040 | -0.00210802 | 0.470180 | 229.982 |
| 3 | 07030037 | 0.467574 | 0.000497997 | 224.166 | 07030039 | -0.000163051 | 0.468235 | 217.635 |