| Red | Green | Blue | |
| z | 17.64 | ||
| znorm | Inf | ||
| sky | -Inf | -Inf | -Inf |
| S/N | 23.7 | 41.6 | 46.0 |
| S/N(c) | 0.0 | 0.0 | 0.0 |
| SN(E/C) |
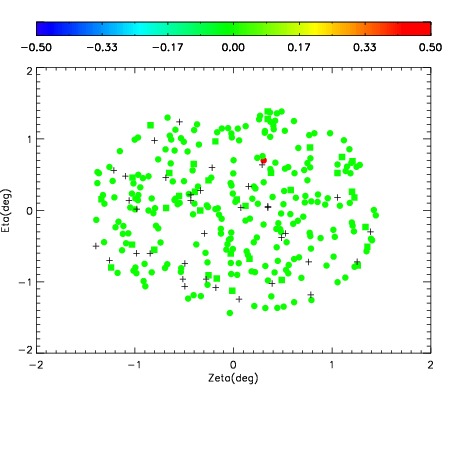
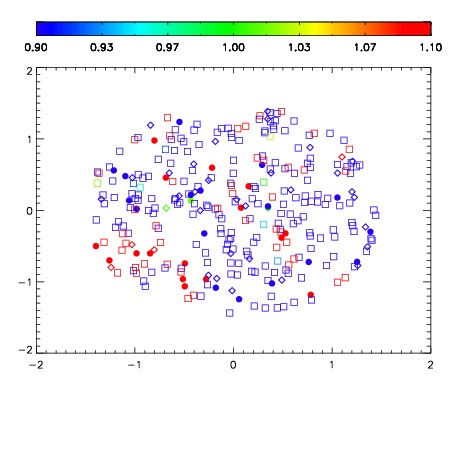
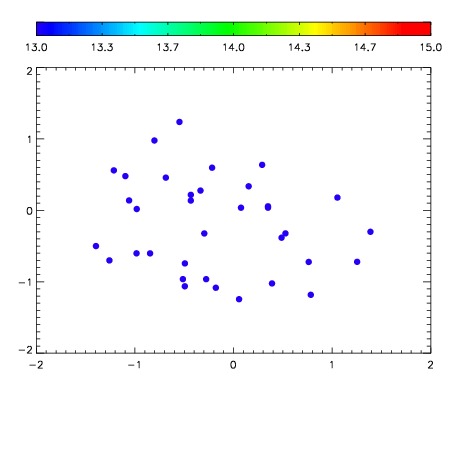

| Frame | Nreads | Zeropoints | Mag plots | Spatial mag deviation | Spatial sky 16325A emission deviations (filled: sky, open: star) | Spatial sky continuum emission | Spatial sky telluric CO2 absorption deviations (filled: H < 10) | |||||||||||||||||||||||
| 0 | 0 |
|
|
|
|
|
|
| IPAIR | NAME | SHIFT | NEWSHIFT | S/N | NAME | SHIFT | NEWSHIFT | S/N |
| 0 | 07210049 | 0.480890 | 0.00000 | 266.591 | 07210048 | 0.00000 | 0.480890 | 259.232 |
| 1 | 07210050 | 0.480865 | 2.50041e-05 | 268.296 | 07210051 | 0.00162756 | 0.479262 | 267.290 |
| 2 | 07210053 | 0.479237 | 0.00165302 | 215.664 | 07210052 | 0.00456977 | 0.476320 | 250.716 |
| 3 | 07210054 | 0.480723 | 0.000167012 | 166.952 | 07210055 | -0.00179542 | 0.482685 | 178.937 |