| Red | Green | Blue | |
| z | 17.64 | ||
| znorm | Inf | ||
| sky | -Inf | -Inf | -Inf |
| S/N | 30.2 | 50.6 | 57.8 |
| S/N(c) | 0.0 | 0.0 | 0.0 |
| SN(E/C) |

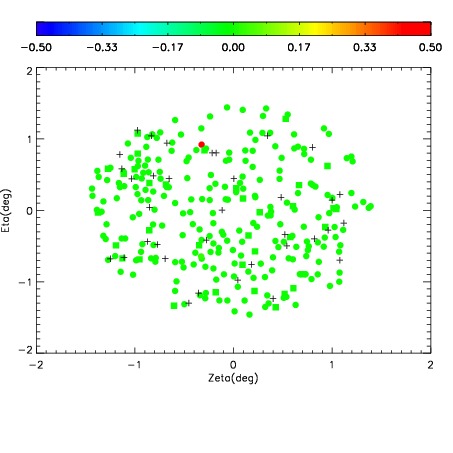
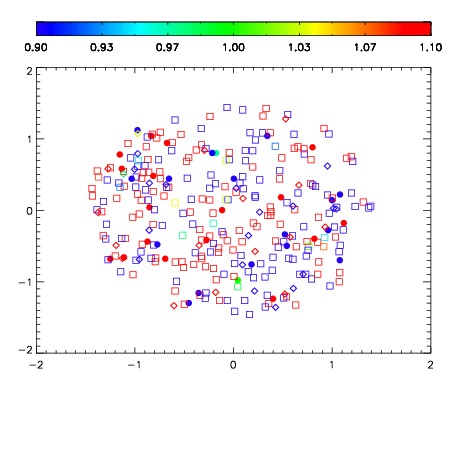
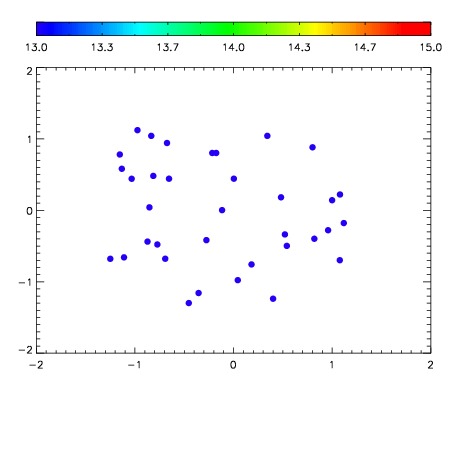

| Frame | Nreads | Zeropoints | Mag plots | Spatial mag deviation | Spatial sky 16325A emission deviations (filled: sky, open: star) | Spatial sky continuum emission | Spatial sky telluric CO2 absorption deviations (filled: H < 10) | |||||||||||||||||||||||
| 0 | 0 |
|
|
|
|
|
|
| IPAIR | NAME | SHIFT | NEWSHIFT | S/N | NAME | SHIFT | NEWSHIFT | S/N |
| 0 | 10820082 | 0.512863 | 0.00000 | 227.173 | 10820083 | 0.0201735 | 0.492689 | 239.466 |
| 1 | 10820081 | 0.512577 | 0.000285983 | 224.632 | 10820076 | -0.00134464 | 0.514208 | 231.602 |
| 2 | 10820077 | 0.482782 | 0.0300810 | 219.434 | 10820075 | -0.00171001 | 0.514573 | 225.195 |
| 3 | 10820078 | 0.482802 | 0.0300610 | 218.590 | 10820079 | 0.0210565 | 0.491806 | 215.466 |
| 4 | 10820073 | 0.480508 | 0.0323550 | 213.201 | 10820080 | 0.0213450 | 0.491518 | 210.551 |
| 5 | 10820074 | 0.482996 | 0.0298670 | 202.810 | 10820072 | 0.00000 | 0.512863 | 199.449 |