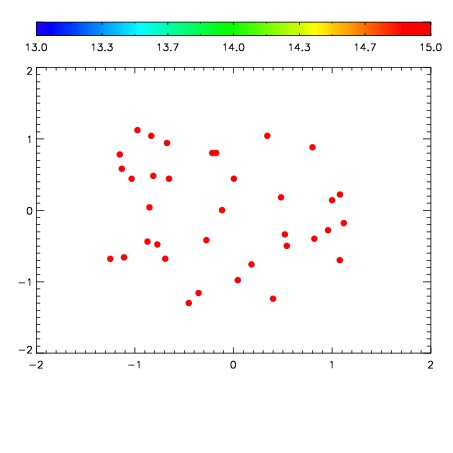
| Frame | Nreads | Zeropoints | Mag plots
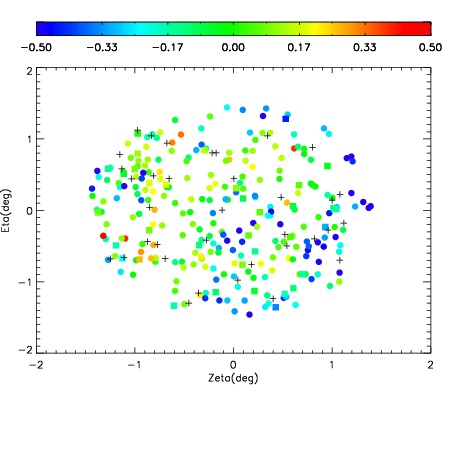
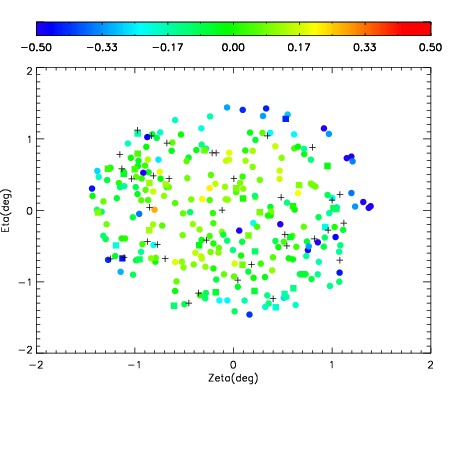
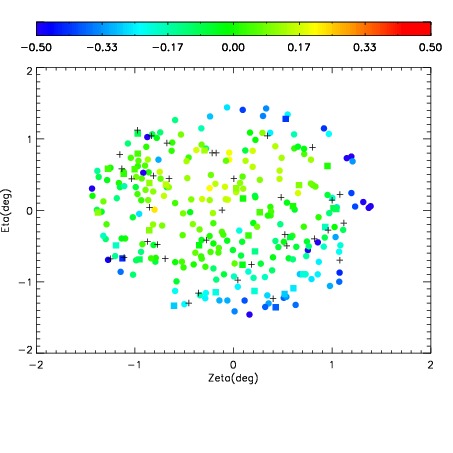
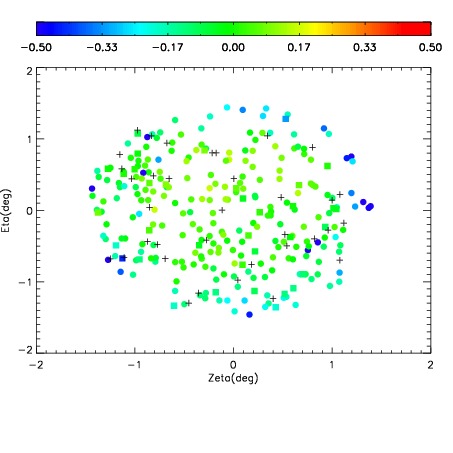
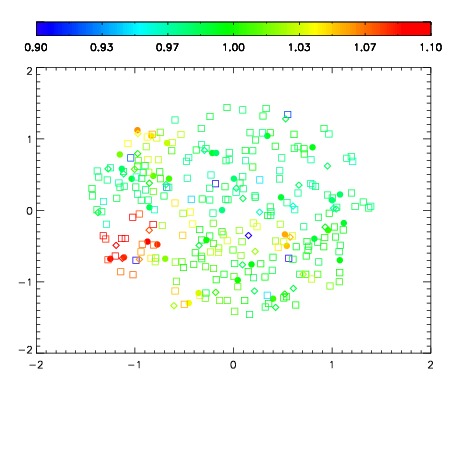
| Spatial mag deviation
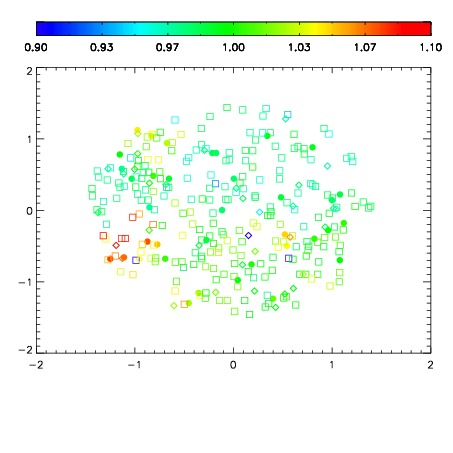
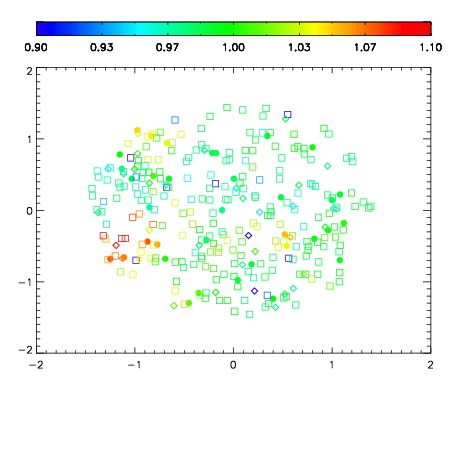
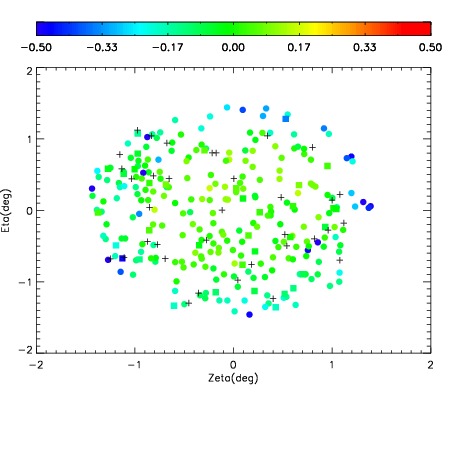
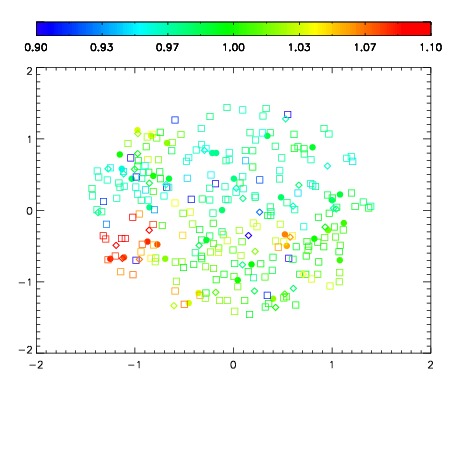
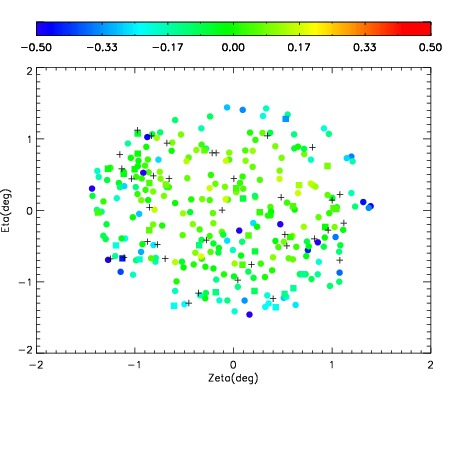
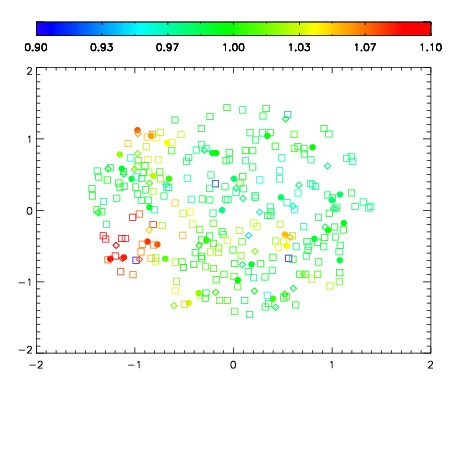
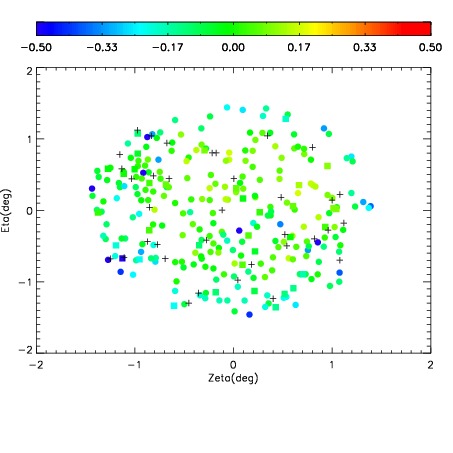
| Spatial sky 16325A emission deviations (filled: sky, open: star)
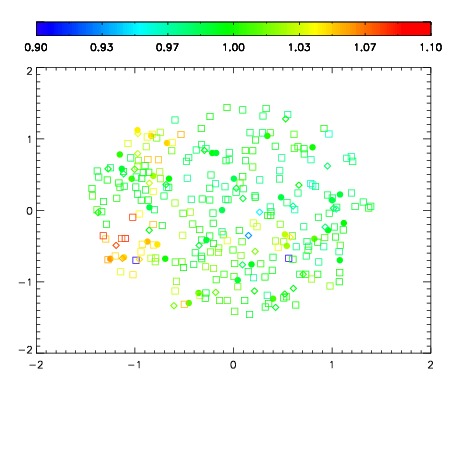
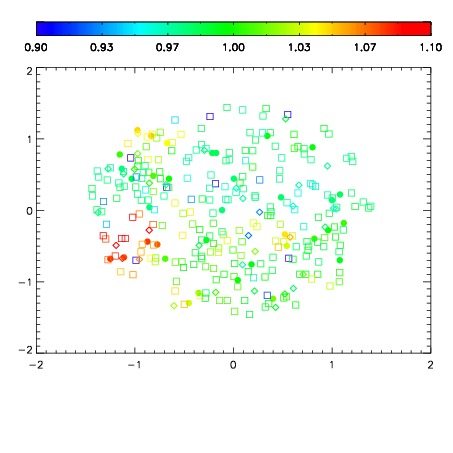
| Spatial sky continuum emission
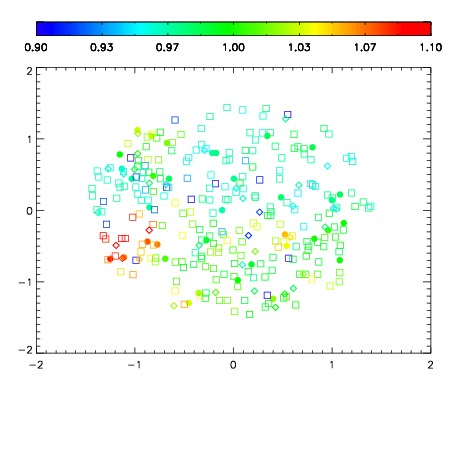
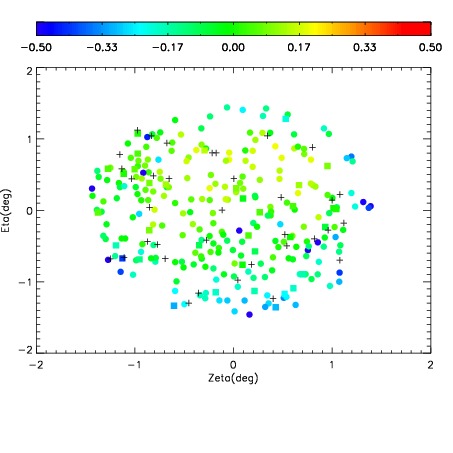
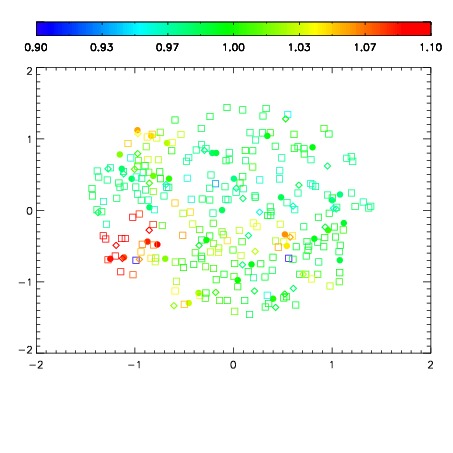
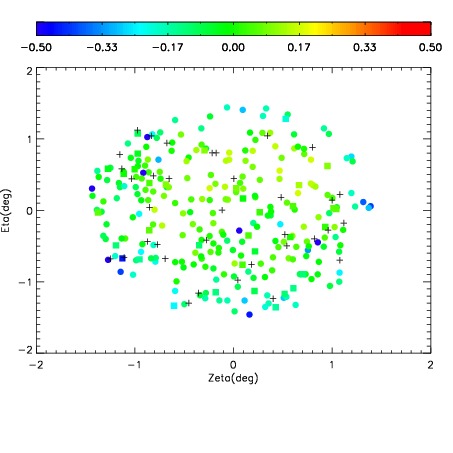
| Spatial sky telluric CO2 absorption deviations (filled: H < 10)
|
| 10930035
| 47
| | Red | Green | Blue
| | z | | 15.07
| | znorm | | 10.89
| | sky | 15.5 | 15.3 | 15.3
| | S/N | 0.6 | 1.3 | 2.7
| | S/N(c) | 0.4 | 1.3 | 2.3
| | SN(E/C) 0.99
|
| 
| 
| 
| 
| 
|
| 10930036
| 47
| | Red | Green | Blue
| | z | | 16.15
| | znorm | | 11.97
| | sky | 15.5 | 15.2 | 15.7
| | S/N | 1.5 | 3.6 | 4.4
| | S/N(c) | 1.3 | 3.3 | 3.9
| | SN(E/C) 1.03
|
| 
| 
| 
| 
| 
|
| 10930037
| 47
| | Red | Green | Blue
| | z | | 17.25
| | znorm | | 13.07
| | sky | 15.4 | 15.3 | 15.6
| | S/N | 3.8 | 8.2 | 9.4
| | S/N(c) | 3.2 | 7.3 | 8.5
| | SN(E/C) 0.97
|
| 
| 
| 
| 
| 
|
| 10930038
| 47
| | Red | Green | Blue
| | z | | 17.49
| | znorm | | 13.31
| | sky | 15.4 | 15.2 | 15.8
| | S/N | 4.6 | 9.6 | 10.9
| | S/N(c) | 4.0 | 8.7 | 9.9
| | SN(E/C) 1.01
|
| 
| 
| 
| 
| 
|
| 10930039
| 47
| | Red | Green | Blue
| | z | | 17.87
| | znorm | | 13.69
| | sky | 15.1 | 15.1 | 15.5
| | S/N | 6.5 | 12.6 | 13.9
| | S/N(c) | 5.6 | 11.4 | 12.7
| | SN(E/C) 0.96
|
| 
| 
| 
| 
| 
|
| 10930040
| 47
| | Red | Green | Blue
| | z | | 17.75
| | znorm | | 13.57
| | sky | 15.5 | 15.3 | 15.6
| | S/N | 5.9 | 11.7 | 12.7
| | S/N(c) | 5.0 | 10.4 | 11.8
| | SN(E/C) 0.99
|
| 
| 
| 
| 
| 
|
| 10930041
| 47
| | Red | Green | Blue
| | z | | 16.65
| | znorm | | 12.47
| | sky | 15.8 | 15.3 | 15.8
| | S/N | 2.2 | 5.0 | 6.6
| | S/N(c) | 1.9 | 4.8 | 6.0
| | SN(E/C) 1.00
|
| 
| 
| 
| 
| 
|
| 10930042
| 47
| | Red | Green | Blue
| | z | | 16.01
| | znorm | | 11.83
| | sky | 15.5 | 15.6 | 16.0
| | S/N | 1.2 | 3.2 | 3.9
| | S/N(c) | 1.1 | 2.9 | 3.5
| | SN(E/C) 0.97
|
| 
| 
| 
| 
| 
|
| 10930043
| 47
| | Red | Green | Blue
| | z | | 16.35
| | znorm | | 12.17
| | sky | 15.1 | 15.4 | 15.8
| | S/N | 1.8 | 4.3 | 5.3
| | S/N(c) | 1.5 | 3.7 | 4.8
| | SN(E/C) 1.01
|
| 
| 
| 
| 
| 
|
| 10930044
| 47
| | Red | Green | Blue
| | z | | 16.68
| | znorm | | 12.50
| | sky | 15.0 | 15.2 | 16.3
| | S/N | 2.2 | 5.4 | 6.5
| | S/N(c) | 2.0 | 4.9 | 5.9
| | SN(E/C) 0.94
|
| 
| 
| 
| 
| 
|
| 10930045
| 47
| | Red | Green | Blue
| | z | | 16.67
| | znorm | | 12.49
| | sky | 15.8 | 15.4 | 15.8
| | S/N | 2.2 | 5.5 | 6.2
| | S/N(c) | 1.9 | 4.9 | 5.6
| | SN(E/C) 0.99
|
| 
| 
| 
| 
| 
|
| 10930046
| 47
| | Red | Green | Blue
| | z | | 16.35
| | znorm | | 12.17
| | sky | 15.6 | 15.3 | 16.0
| | S/N | 1.8 | 4.3 | 5.1
| | S/N(c) | 1.6 | 3.8 | 4.6
| | SN(E/C) 0.95
|
| 
| 
| 
| 
| 
|