| Red | Green | Blue | |
| z | 17.64 | ||
| znorm | Inf | ||
| sky | -Inf | -Inf | -Inf |
| S/N | 20.7 | 37.0 | 42.3 |
| S/N(c) | 0.0 | 0.0 | 0.0 |
| SN(E/C) |
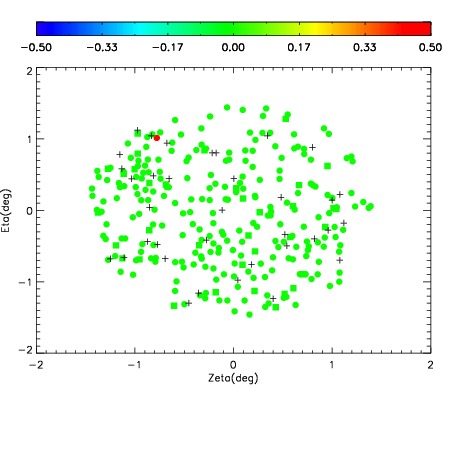
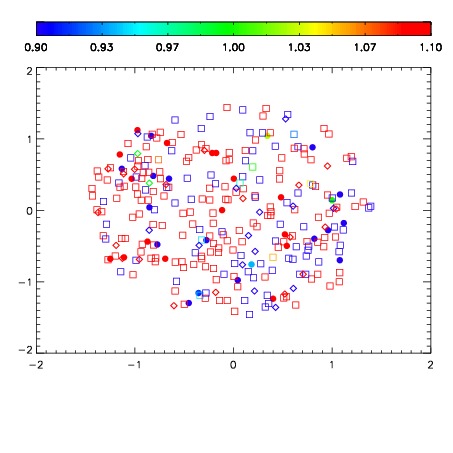
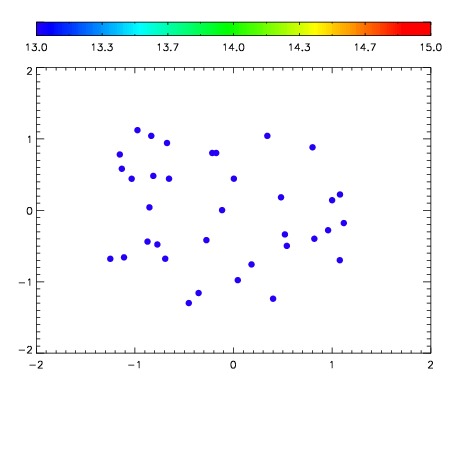

| Frame | Nreads | Zeropoints | Mag plots | Spatial mag deviation | Spatial sky 16325A emission deviations (filled: sky, open: star) | Spatial sky continuum emission | Spatial sky telluric CO2 absorption deviations (filled: H < 10) | |||||||||||||||||||||||
| 0 | 0 |
|
|
|
|
|
|
| IPAIR | NAME | SHIFT | NEWSHIFT | S/N | NAME | SHIFT | NEWSHIFT | S/N |
| 0 | 11080061 | 0.475469 | 0.00000 | 208.091 | 11080066 | -0.00562013 | 0.481089 | 212.445 |
| 1 | 11080065 | 0.472499 | 0.00296998 | 235.052 | 11080063 | -0.00267221 | 0.478141 | 219.185 |
| 2 | 11080064 | 0.475071 | 0.000397980 | 218.174 | 11080059 | 0.00000 | 0.475469 | 213.602 |
| 3 | 11080060 | 0.475252 | 0.000216991 | 204.738 | 11080062 | -0.00347962 | 0.478949 | 210.322 |