| Red | Green | Blue | |
| z | 17.64 | ||
| znorm | Inf | ||
| sky | -Inf | -Inf | -Inf |
| S/N | 25.5 | 44.1 | 48.5 |
| S/N(c) | 0.0 | 0.0 | 0.0 |
| SN(E/C) |
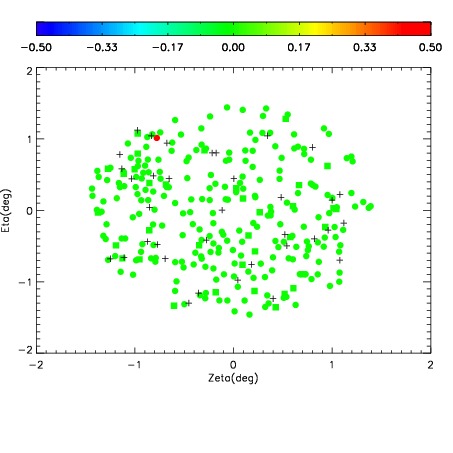
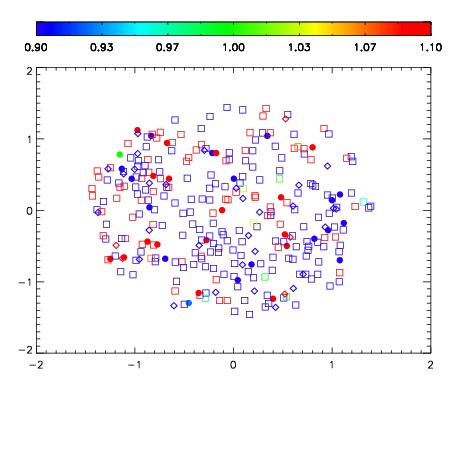
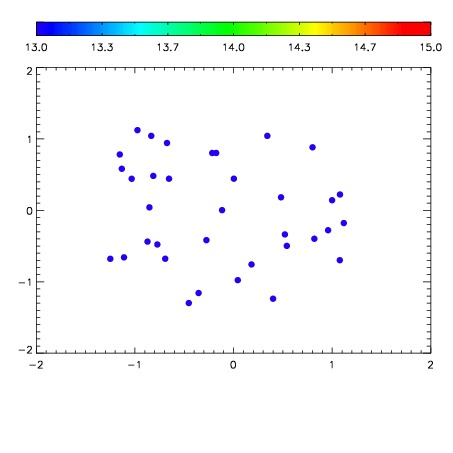

| Frame | Nreads | Zeropoints | Mag plots | Spatial mag deviation | Spatial sky 16325A emission deviations (filled: sky, open: star) | Spatial sky continuum emission | Spatial sky telluric CO2 absorption deviations (filled: H < 10) | |||||||||||||||||||||||
| 0 | 0 |
|
|
|
|
|
|
| IPAIR | NAME | SHIFT | NEWSHIFT | S/N | NAME | SHIFT | NEWSHIFT | S/N |
| 0 | 11350034 | 0.477649 | 0.00000 | 220.606 | 11350036 | -0.00324076 | 0.480890 | 220.447 |
| 1 | 11350038 | 0.476830 | 0.000818998 | 250.325 | 11350039 | -0.00419841 | 0.481847 | 251.095 |
| 2 | 11350037 | 0.476125 | 0.00152400 | 231.853 | 11350035 | -0.00345110 | 0.481100 | 229.345 |
| 3 | 11350033 | 0.476592 | 0.00105700 | 200.961 | 11350032 | 0.00000 | 0.477649 | 184.768 |