| Red | Green | Blue | |
| z | 17.64 | ||
| znorm | Inf | ||
| sky | -Inf | -Inf | -Inf |
| S/N | 14.2 | 26.4 | 27.4 |
| S/N(c) | 0.0 | 0.0 | 0.0 |
| SN(E/C) |

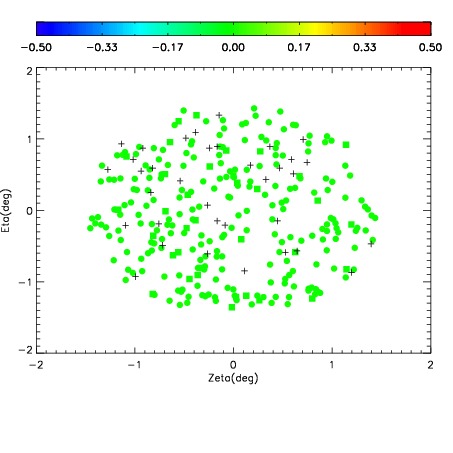
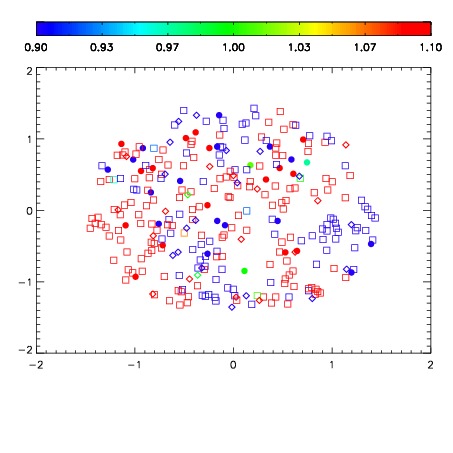
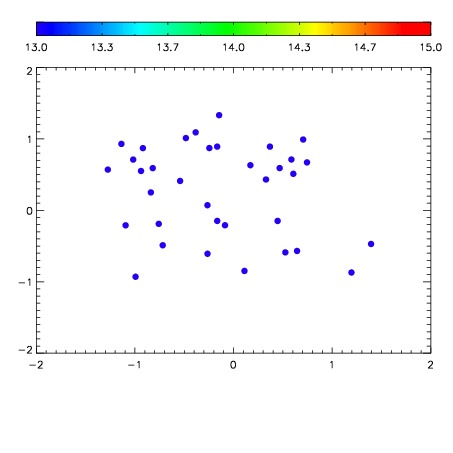

| Frame | Nreads | Zeropoints | Mag plots | Spatial mag deviation | Spatial sky 16325A emission deviations (filled: sky, open: star) | Spatial sky continuum emission | Spatial sky telluric CO2 absorption deviations (filled: H < 10) | |||||||||||||||||||||||
| 0 | 0 |
|
|
|
|
|
|
| IPAIR | NAME | SHIFT | NEWSHIFT | S/N | NAME | SHIFT | NEWSHIFT | S/N |
| 0 | 08100017 | 0.523235 | 0.00000 | 129.726 | 08100018 | 0.000842738 | 0.522392 | 119.880 |
| 1 | 08100012 | 0.516351 | 0.00688404 | 170.474 | 08100011 | 0.00000 | 0.523235 | 171.003 |
| 2 | 08100013 | 0.522973 | 0.000262022 | 165.345 | 08100015 | -0.00113581 | 0.524371 | 167.062 |
| 3 | 08100016 | 0.519063 | 0.00417203 | 151.431 | 08100014 | -3.48249e-05 | 0.523270 | 157.189 |