| Red | Green | Blue | |
| z | 17.64 | ||
| znorm | Inf | ||
| sky | -Inf | -Inf | -Inf |
| S/N | 21.0 | 38.3 | 45.7 |
| S/N(c) | 0.0 | 0.0 | 0.0 |
| SN(E/C) |
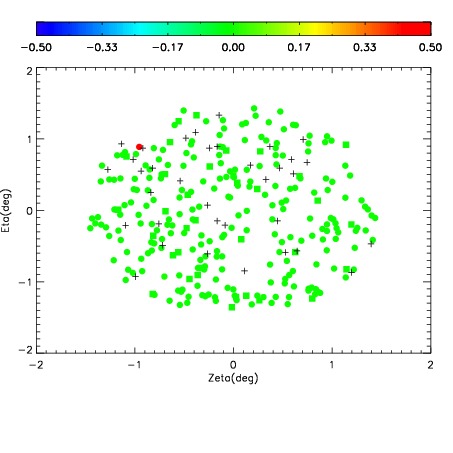
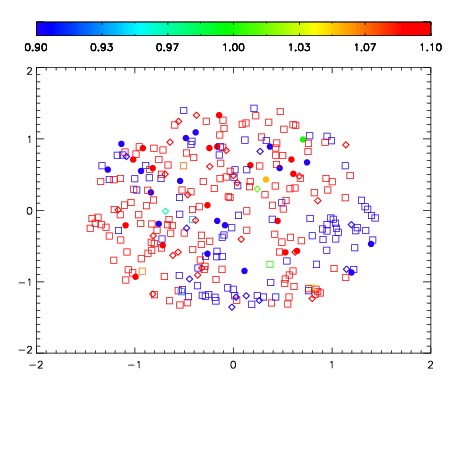
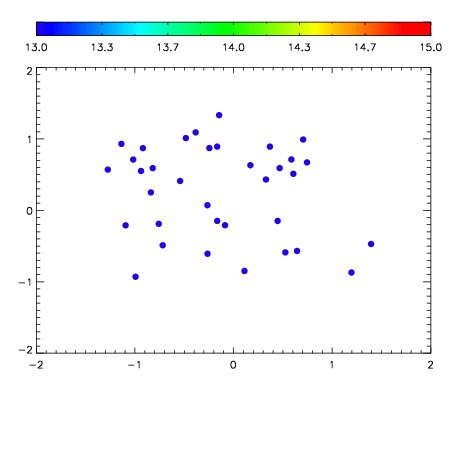

| Frame | Nreads | Zeropoints | Mag plots | Spatial mag deviation | Spatial sky 16325A emission deviations (filled: sky, open: star) | Spatial sky continuum emission | Spatial sky telluric CO2 absorption deviations (filled: H < 10) | |||||||||||||||||||||||
| 0 | 0 |
|
|
|
|
|
|
| IPAIR | NAME | SHIFT | NEWSHIFT | S/N | NAME | SHIFT | NEWSHIFT | S/N |
| 0 | 10810070 | 0.485249 | 0.00000 | 134.248 | 10810069 | 0.000181306 | 0.485068 | 142.074 |
| 1 | 10810066 | 0.483850 | 0.00139901 | 131.419 | 10810068 | 0.000240974 | 0.485008 | 138.263 |
| 2 | 10810062 | 0.482279 | 0.00297001 | 126.856 | 10810065 | 0.000577932 | 0.484671 | 134.407 |
| 3 | 10810067 | 0.483526 | 0.00172302 | 119.770 | 10810061 | 0.00000 | 0.485249 | 124.266 |
| 4 | 10810063 | 0.483532 | 0.00171700 | 119.078 | 10810064 | -0.000613899 | 0.485863 | 124.190 |