| Red | Green | Blue | |
| z | 17.64 | ||
| znorm | Inf | ||
| sky | -Inf | -Inf | -Inf |
| S/N | 17.4 | 32.5 | 36.6 |
| S/N(c) | 0.0 | 0.0 | 0.0 |
| SN(E/C) |
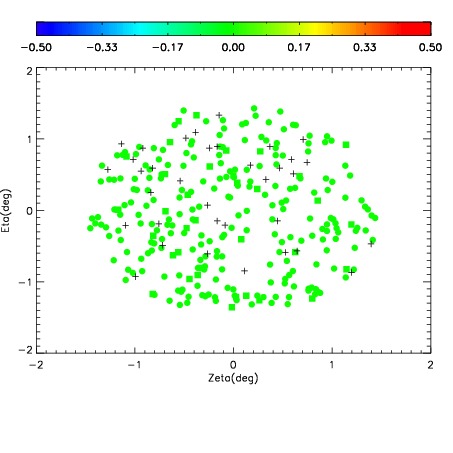
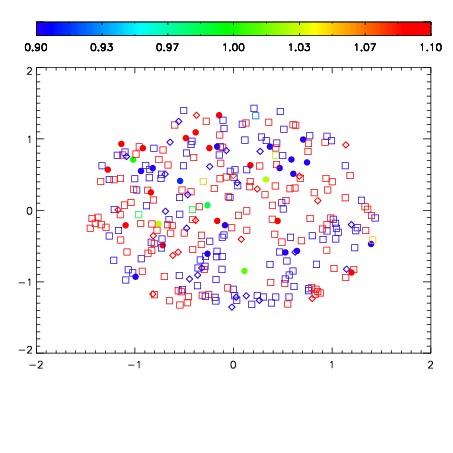
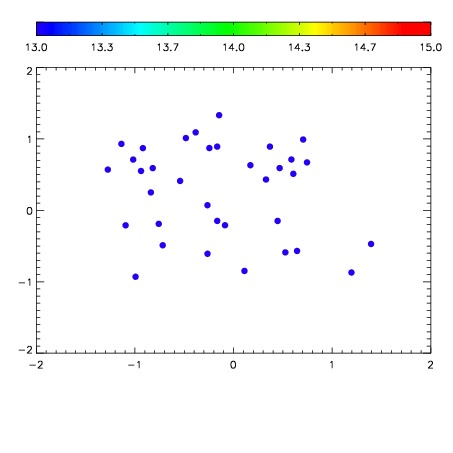

| Frame | Nreads | Zeropoints | Mag plots | Spatial mag deviation | Spatial sky 16325A emission deviations (filled: sky, open: star) | Spatial sky continuum emission | Spatial sky telluric CO2 absorption deviations (filled: H < 10) | |||||||||||||||||||||||
| 0 | 0 |
|
|
|
|
|
|
| IPAIR | NAME | SHIFT | NEWSHIFT | S/N | NAME | SHIFT | NEWSHIFT | S/N |
| 0 | 10910059 | 0.511119 | 0.00000 | 185.275 | 10910060 | -0.00194434 | 0.513063 | 193.532 |
| 1 | 10910062 | 0.509951 | 0.00116801 | 197.257 | 10910061 | -0.00166282 | 0.512782 | 194.210 |
| 2 | 10910058 | 0.510713 | 0.000406027 | 182.211 | 10910057 | 0.00000 | 0.511119 | 191.742 |