| Red | Green | Blue | |
| z | 17.64 | ||
| znorm | Inf | ||
| sky | -Inf | -Inf | -Inf |
| S/N | 21.4 | 38.7 | 41.1 |
| S/N(c) | 0.0 | 0.0 | 0.0 |
| SN(E/C) |
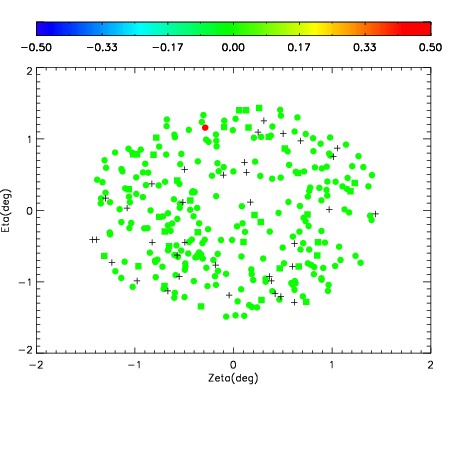
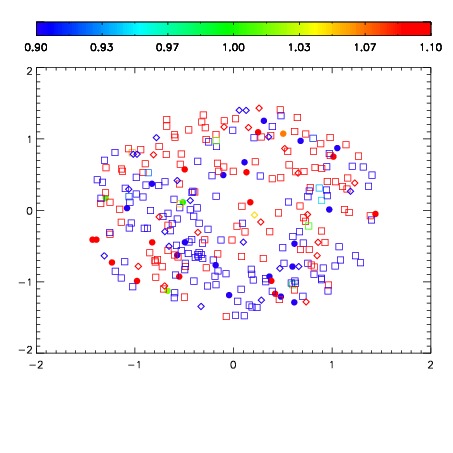


| Frame | Nreads | Zeropoints | Mag plots | Spatial mag deviation | Spatial sky 16325A emission deviations (filled: sky, open: star) | Spatial sky continuum emission | Spatial sky telluric CO2 absorption deviations (filled: H < 10) | |||||||||||||||||||||||
| 0 | 0 |
|
|
|
|
|
|
| IPAIR | NAME | SHIFT | NEWSHIFT | S/N | NAME | SHIFT | NEWSHIFT | S/N |
| 0 | 07050028 | 0.466858 | 0.00000 | 175.177 | 07050026 | 0.00000 | 0.466858 | 167.849 |
| 1 | 07050031 | 0.465726 | 0.00113201 | 210.137 | 07050030 | 0.000546453 | 0.466312 | 213.144 |
| 2 | 07050032 | 0.465941 | 0.000916988 | 209.957 | 07050033 | 0.00157375 | 0.465284 | 206.851 |
| 3 | 07050027 | 0.466301 | 0.000557005 | 175.688 | 07050029 | 0.000943077 | 0.465915 | 198.488 |