| Red | Green | Blue | |
| z | 17.64 | ||
| znorm | Inf | ||
| sky | -Inf | -Inf | -Inf |
| S/N | 20.3 | 37.0 | 40.6 |
| S/N(c) | 0.0 | 0.0 | 0.0 |
| SN(E/C) |

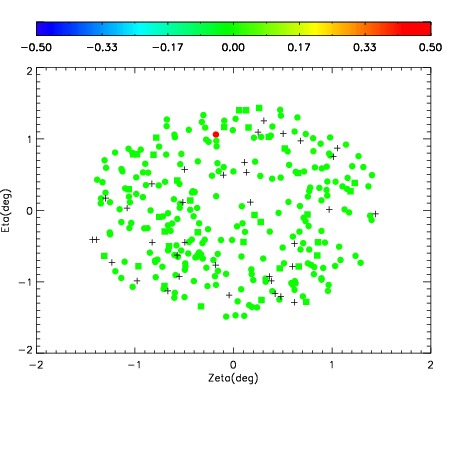
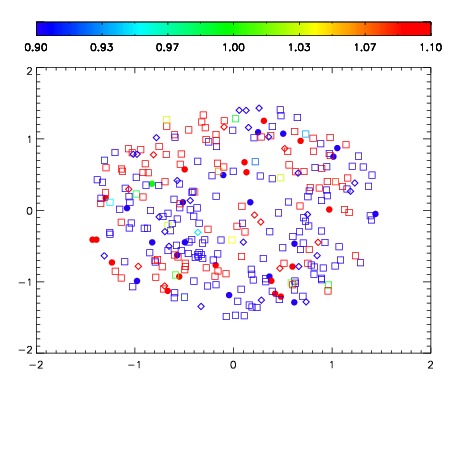


| Frame | Nreads | Zeropoints | Mag plots | Spatial mag deviation | Spatial sky 16325A emission deviations (filled: sky, open: star) | Spatial sky continuum emission | Spatial sky telluric CO2 absorption deviations (filled: H < 10) | |||||||||||||||||||||||
| 0 | 0 |
|
|
|
|
|
|
| IPAIR | NAME | SHIFT | NEWSHIFT | S/N | NAME | SHIFT | NEWSHIFT | S/N |
| 0 | 07260065 | 0.471444 | 0.00000 | 155.628 | 07260064 | 0.00000 | 0.471444 | 148.911 |
| 1 | 07260070 | 0.469938 | 0.00150600 | 180.983 | 07260071 | -0.000448958 | 0.471893 | 180.726 |
| 2 | 07260069 | 0.469186 | 0.00225800 | 167.465 | 07260068 | -0.00469235 | 0.476136 | 174.640 |
| 3 | 07260066 | 0.470876 | 0.000568002 | 160.776 | 07260067 | -0.000629731 | 0.472074 | 164.583 |