| Red | Green | Blue | |
| z | 17.64 | ||
| znorm | Inf | ||
| sky | -Inf | -Inf | -Inf |
| S/N | 33.5 | 55.9 | 59.5 |
| S/N(c) | 0.0 | 0.0 | 0.0 |
| SN(E/C) |
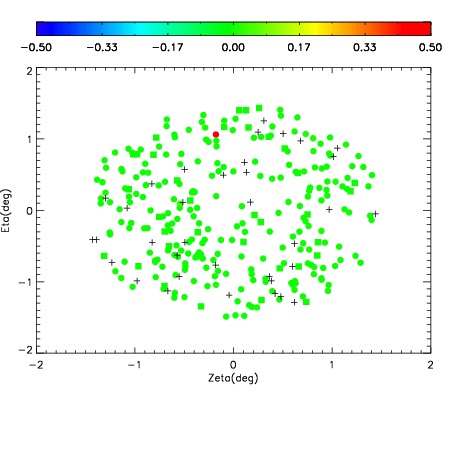
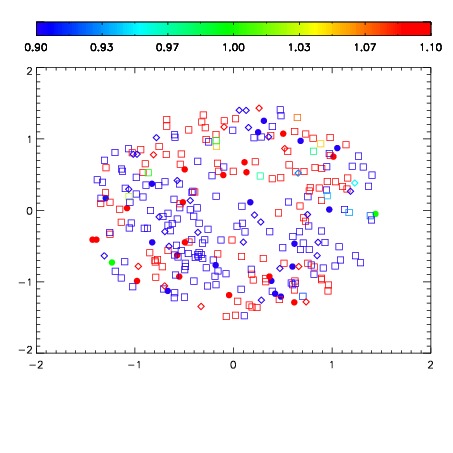
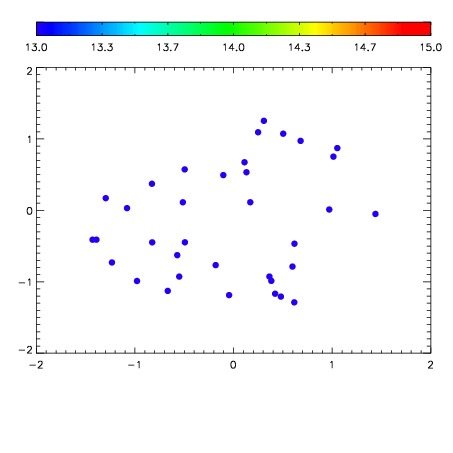

| Frame | Nreads | Zeropoints | Mag plots | Spatial mag deviation | Spatial sky 16325A emission deviations (filled: sky, open: star) | Spatial sky continuum emission | Spatial sky telluric CO2 absorption deviations (filled: H < 10) | |||||||||||||||||||||||
| 0 | 0 |
|
|
|
|
|
|
| IPAIR | NAME | SHIFT | NEWSHIFT | S/N | NAME | SHIFT | NEWSHIFT | S/N |
| 0 | 10300039 | 0.495046 | 0.00000 | 216.034 | 10300038 | 0.00000 | 0.495046 | 215.462 |
| 1 | 10300043 | 0.493157 | 0.00188899 | 226.380 | 10300042 | 0.00208270 | 0.492963 | 227.472 |
| 2 | 10300047 | 0.492807 | 0.00223899 | 225.654 | 10300041 | 0.00212620 | 0.492920 | 226.001 |
| 3 | 10300040 | 0.494375 | 0.000670999 | 223.927 | 10300046 | 0.00377702 | 0.491269 | 225.016 |
| 4 | 10300044 | 0.493950 | 0.00109598 | 223.863 | 10300045 | 0.00367404 | 0.491372 | 223.684 |