| Red | Green | Blue | |
| z | 17.64 | ||
| znorm | Inf | ||
| sky | -Inf | -Inf | -Inf |
| S/N | 34.6 | 59.1 | 64.7 |
| S/N(c) | 0.0 | 0.0 | 0.0 |
| SN(E/C) |
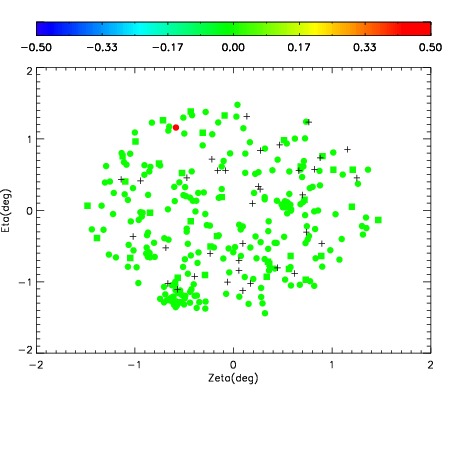
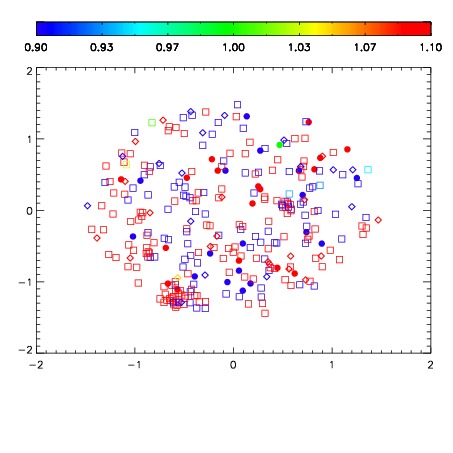
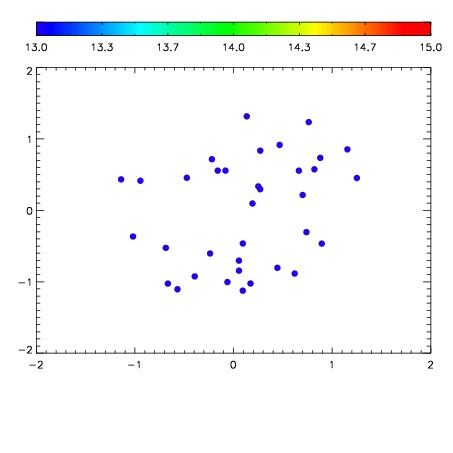

| Frame | Nreads | Zeropoints | Mag plots | Spatial mag deviation | Spatial sky 16325A emission deviations (filled: sky, open: star) | Spatial sky continuum emission | Spatial sky telluric CO2 absorption deviations (filled: H < 10) | |||||||||||||||||||||||
| 0 | 0 |
|
|
|
|
|
|
| IPAIR | NAME | SHIFT | NEWSHIFT | S/N | NAME | SHIFT | NEWSHIFT | S/N |
| 0 | 06990083 | 0.485639 | 0.00000 | 235.658 | 06990084 | 0.00245473 | 0.483184 | 233.733 |
| 1 | 06990082 | 0.481617 | 0.00402200 | 233.450 | 06990081 | 0.00220159 | 0.483437 | 233.070 |
| 2 | 06990086 | 0.480745 | 0.00489402 | 233.169 | 06990080 | 0.00397666 | 0.481662 | 230.740 |
| 3 | 06990079 | 0.483007 | 0.00263199 | 230.698 | 06990085 | 0.00312460 | 0.482514 | 227.033 |
| 4 | 06990087 | 0.484463 | 0.00117600 | 229.955 | 06990088 | 0.00409703 | 0.481542 | 223.545 |
| 5 | 06990078 | 0.479246 | 0.00639302 | 227.397 | 06990077 | 0.00000 | 0.485639 | 221.831 |