| Red | Green | Blue | |
| z | 17.64 | ||
| znorm | Inf | ||
| sky | -Inf | -Inf | -Inf |
| S/N | 23.0 | 40.5 | 43.9 |
| S/N(c) | 0.0 | 0.0 | 0.0 |
| SN(E/C) |
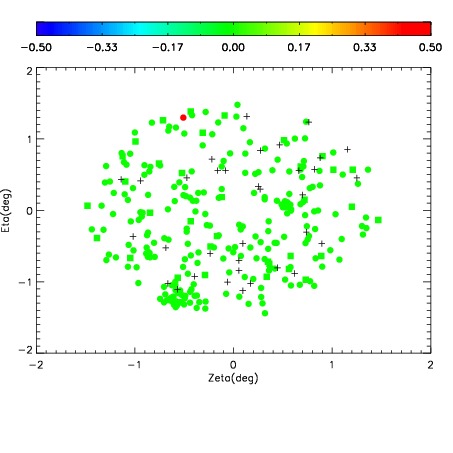

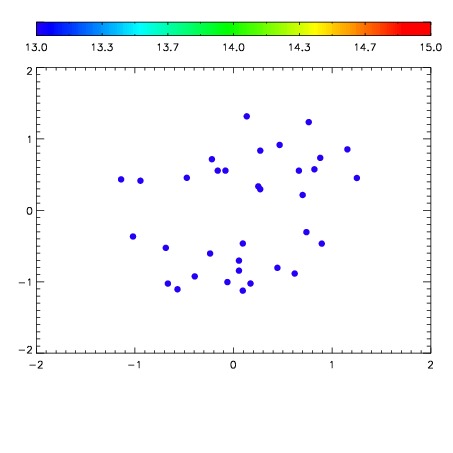

| Frame | Nreads | Zeropoints | Mag plots | Spatial mag deviation | Spatial sky 16325A emission deviations (filled: sky, open: star) | Spatial sky continuum emission | Spatial sky telluric CO2 absorption deviations (filled: H < 10) | |||||||||||||||||||||||
| 0 | 0 |
|
|
|
|
|
|
| IPAIR | NAME | SHIFT | NEWSHIFT | S/N | NAME | SHIFT | NEWSHIFT | S/N |
| 0 | 10900035 | 0.518148 | 0.00000 | 180.753 | 10900033 | 0.00000 | 0.518148 | 183.807 |
| 1 | 10900038 | 0.517332 | 0.000815988 | 201.276 | 10900037 | -0.000598589 | 0.518747 | 201.103 |
| 2 | 10900039 | 0.517676 | 0.000472009 | 196.305 | 10900036 | -0.000711415 | 0.518859 | 198.444 |
| 3 | 10900034 | 0.518073 | 7.49826e-05 | 181.079 | 10900040 | -1.94216e-05 | 0.518167 | 189.233 |