| Red | Green | Blue | |
| z | 17.64 | ||
| znorm | Inf | ||
| sky | -Inf | -Inf | -Inf |
| S/N | 20.8 | 38.8 | 41.6 |
| S/N(c) | 0.0 | 0.0 | 0.0 |
| SN(E/C) |

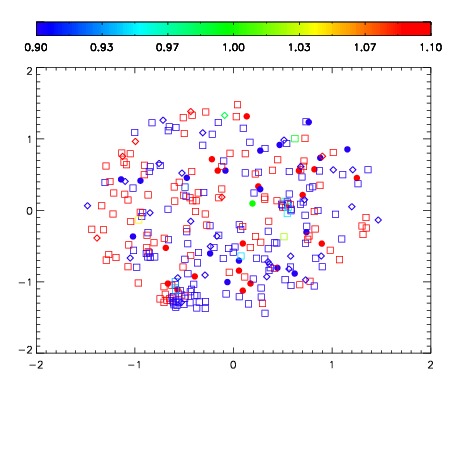
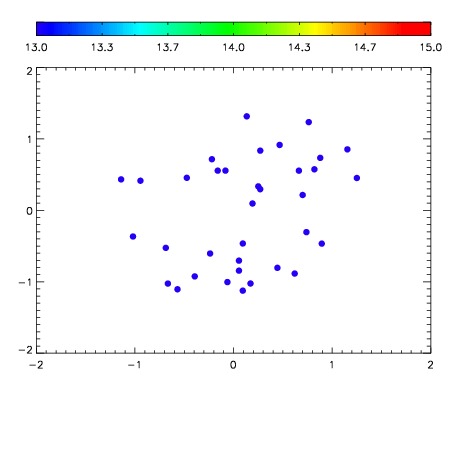

| Frame | Nreads | Zeropoints | Mag plots | Spatial mag deviation | Spatial sky 16325A emission deviations (filled: sky, open: star) | Spatial sky continuum emission | Spatial sky telluric CO2 absorption deviations (filled: H < 10) | |||||||||||||||||||||||
| 0 | 0 |
|
|
|
|
|
|
| IPAIR | NAME | SHIFT | NEWSHIFT | S/N | NAME | SHIFT | NEWSHIFT | S/N |
| 0 | 10940055 | 0.571566 | 0.00000 | 163.990 | 10940050 | 0.00000 | 0.571566 | 153.495 |
| 1 | 10940056 | 0.571439 | 0.000126958 | 171.596 | 10940053 | 0.0526361 | 0.518930 | 167.670 |
| 2 | 10940051 | 0.507931 | 0.0636350 | 168.717 | 10940057 | 0.0519301 | 0.519636 | 166.866 |
| 3 | 10940052 | 0.508153 | 0.0634130 | 166.742 | 10940054 | 0.0531436 | 0.518422 | 162.401 |