| Red | Green | Blue | |
| z | 17.64 | ||
| znorm | Inf | ||
| sky | -NaN | -Inf | -Inf |
| S/N | 31.8 | 53.8 | 58.8 |
| S/N(c) | 0.0 | 0.0 | 0.0 |
| SN(E/C) |
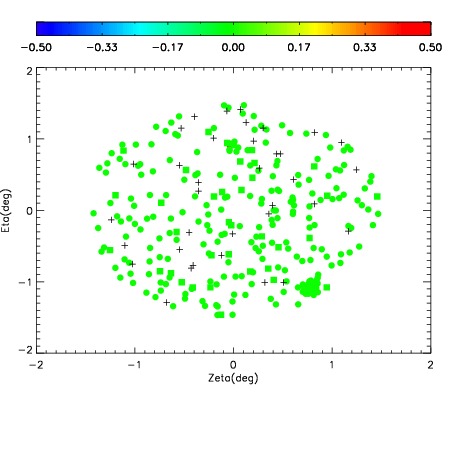
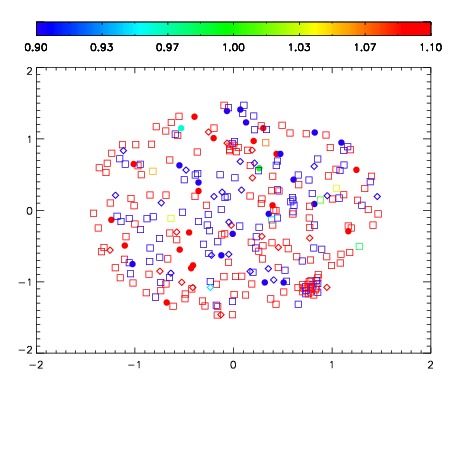
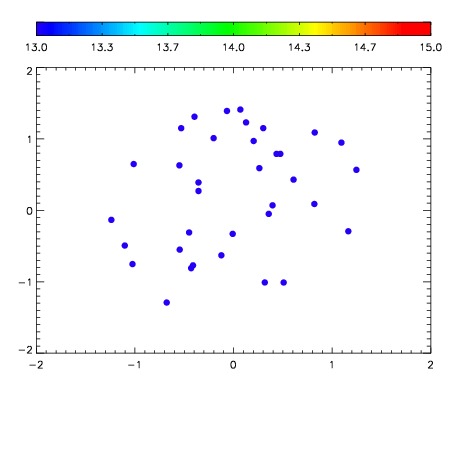

| Frame | Nreads | Zeropoints | Mag plots | Spatial mag deviation | Spatial sky 16325A emission deviations (filled: sky, open: star) | Spatial sky continuum emission | Spatial sky telluric CO2 absorption deviations (filled: H < 10) | |||||||||||||||||||||||
| 0 | 0 |
|
|
|
|
|
|
| IPAIR | NAME | SHIFT | NEWSHIFT | S/N | NAME | SHIFT | NEWSHIFT | S/N |
| 0 | 10800078 | 0.492744 | 0.00000 | 220.025 | 10800079 | 0.000656639 | 0.492087 | 223.299 |
| 1 | 10800082 | 0.492575 | 0.000169009 | 237.731 | 10800080 | 0.000901010 | 0.491843 | 229.193 |
| 2 | 10800081 | 0.491864 | 0.000880003 | 234.920 | 10800083 | 0.00101112 | 0.491733 | 226.197 |
| 3 | 10800077 | 0.491632 | 0.00111198 | 216.953 | 10800076 | -0.000594574 | 0.493339 | 214.494 |
| 4 | 10800074 | 0.490069 | 0.00267500 | 207.497 | 10800075 | -0.00121241 | 0.493956 | 212.369 |
| 5 | 10800073 | 0.489427 | 0.00331700 | 203.443 | 10800072 | 0.00000 | 0.492744 | 195.059 |