| Red | Green | Blue | |
| z | 17.64 | ||
| znorm | Inf | ||
| sky | -Inf | -Inf | -Inf |
| S/N | 27.8 | 50.2 | 53.9 |
| S/N(c) | 0.0 | 0.0 | 0.0 |
| SN(E/C) |
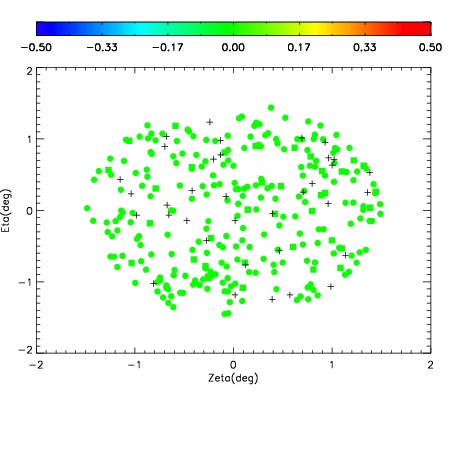
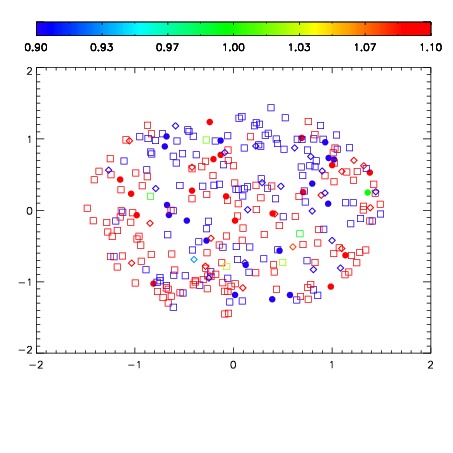
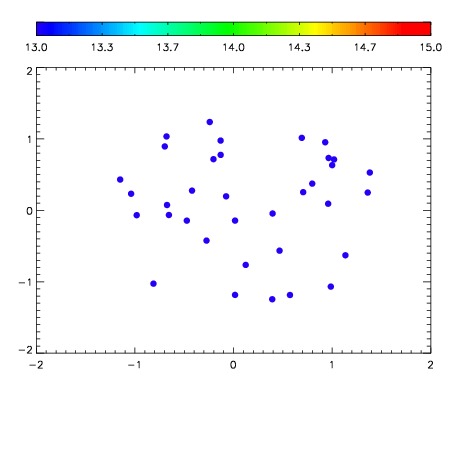

| Frame | Nreads | Zeropoints | Mag plots | Spatial mag deviation | Spatial sky 16325A emission deviations (filled: sky, open: star) | Spatial sky continuum emission | Spatial sky telluric CO2 absorption deviations (filled: H < 10) | |||||||||||||||||||||||
| 0 | 0 |
|
|
|
|
|
|
| IPAIR | NAME | SHIFT | NEWSHIFT | S/N | NAME | SHIFT | NEWSHIFT | S/N |
| 0 | 06660091 | 0.483738 | 0.00000 | 172.920 | 06660089 | 0.00000 | 0.483738 | 158.901 |
| 1 | 06660094 | 0.482603 | 0.00113499 | 186.895 | 06660097 | 0.00341447 | 0.480324 | 186.509 |
| 2 | 06660095 | 0.482802 | 0.000936002 | 184.924 | 06660096 | 0.00751243 | 0.476226 | 183.828 |
| 3 | 06660098 | 0.481443 | 0.00229502 | 181.152 | 06660093 | 0.00660315 | 0.477135 | 178.740 |
| 4 | 06660090 | 0.483285 | 0.000452995 | 174.921 | 06660099 | 0.00485913 | 0.478879 | 177.633 |
| 5 | 06660100 | 0.482364 | 0.00137401 | 174.284 | 06660092 | 0.00441528 | 0.479323 | 171.547 |