| Red | Green | Blue | |
| z | 17.64 | ||
| znorm | Inf | ||
| sky | -Inf | -Inf | -Inf |
| S/N | 30.2 | 51.6 | 55.0 |
| S/N(c) | 0.0 | 0.0 | 0.0 |
| SN(E/C) |
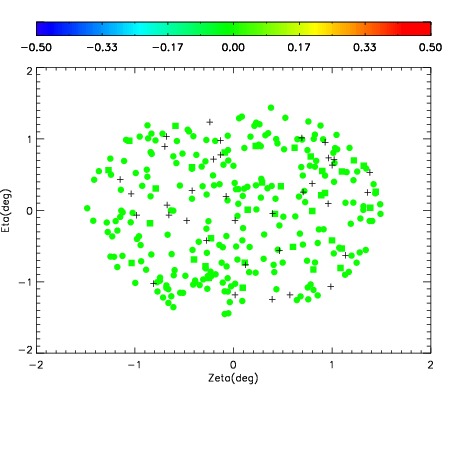
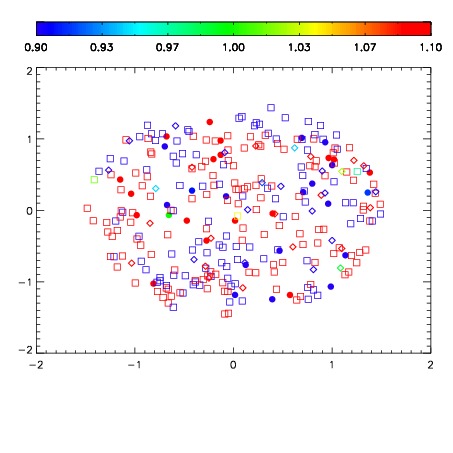
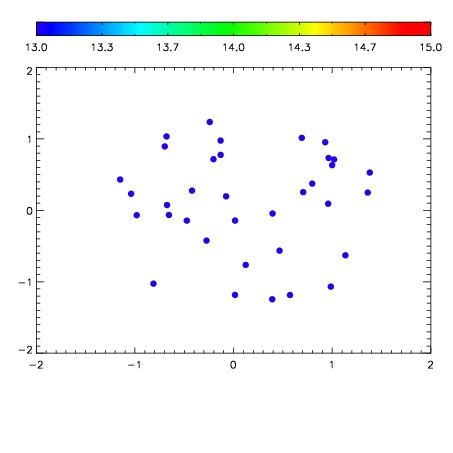

| Frame | Nreads | Zeropoints | Mag plots | Spatial mag deviation | Spatial sky 16325A emission deviations (filled: sky, open: star) | Spatial sky continuum emission | Spatial sky telluric CO2 absorption deviations (filled: H < 10) | |||||||||||||||||||||||
| 0 | 0 |
|
|
|
|
|
|
| IPAIR | NAME | SHIFT | NEWSHIFT | S/N | NAME | SHIFT | NEWSHIFT | S/N |
| 0 | 06700095 | 0.474377 | 0.00000 | 181.392 | 06700092 | 0.00364392 | 0.470733 | 183.220 |
| 1 | 06700094 | 0.473427 | 0.000950009 | 183.399 | 06700093 | 0.00158418 | 0.472793 | 185.790 |
| 2 | 06700091 | 0.473115 | 0.00126201 | 180.888 | 06700096 | 0.00108738 | 0.473290 | 176.352 |
| 3 | 06700090 | 0.472099 | 0.00227800 | 170.981 | 06700089 | 0.00265958 | 0.471717 | 173.791 |
| 4 | 06700087 | 0.473624 | 0.000753015 | 166.959 | 06700088 | 0.00261672 | 0.471760 | 169.891 |
| 5 | 06700086 | 0.472268 | 0.00210902 | 158.974 | 06700085 | 0.00000 | 0.474377 | 150.812 |