| Red | Green | Blue | |
| z | 17.64 | ||
| znorm | Inf | ||
| sky | -Inf | -Inf | -Inf |
| S/N | 19.5 | 35.4 | 37.2 |
| S/N(c) | 0.0 | 0.0 | 0.0 |
| SN(E/C) |
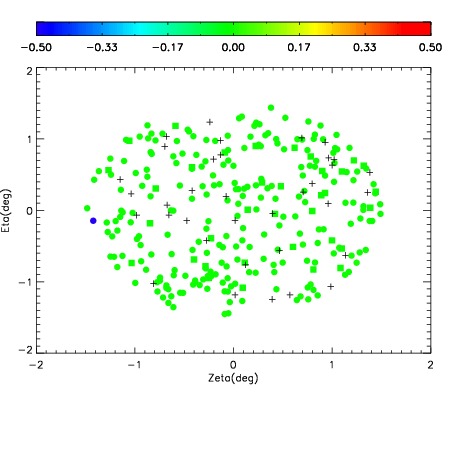
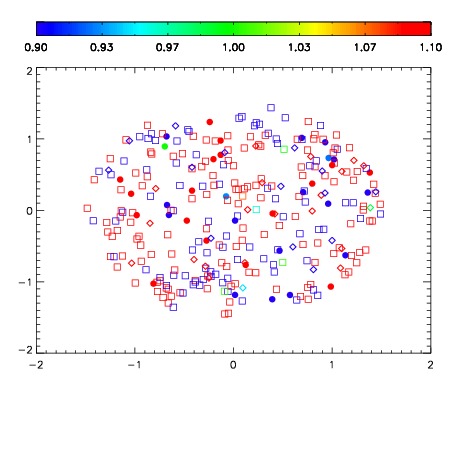
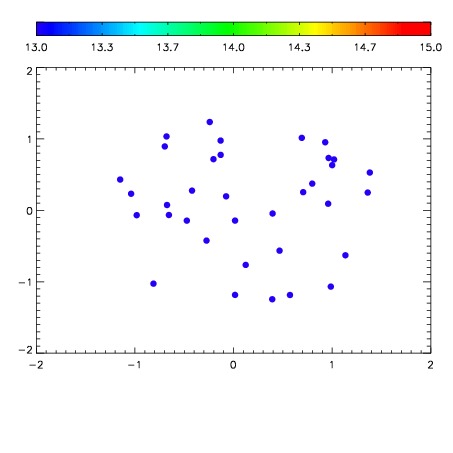

| Frame | Nreads | Zeropoints | Mag plots | Spatial mag deviation | Spatial sky 16325A emission deviations (filled: sky, open: star) | Spatial sky continuum emission | Spatial sky telluric CO2 absorption deviations (filled: H < 10) | |||||||||||||||||||||||
| 0 | 0 |
|
|
|
|
|
|
| IPAIR | NAME | SHIFT | NEWSHIFT | S/N | NAME | SHIFT | NEWSHIFT | S/N |
| 0 | 07020050 | 0.475257 | 0.00000 | 148.373 | 07020052 | 0.00171965 | 0.473537 | 154.816 |
| 1 | 07020049 | 0.474217 | 0.00104001 | 133.531 | 07020051 | 0.00290859 | 0.472348 | 147.884 |
| 2 | 07020053 | 0.473144 | 0.00211301 | 123.892 | 07020055 | -8.68156e-06 | 0.475266 | 139.819 |
| 3 | 07020054 | 0.472568 | 0.00268900 | 115.950 | 07020048 | 0.00000 | 0.475257 | 114.393 |