| Red | Green | Blue | |
| z | 17.64 | ||
| znorm | Inf | ||
| sky | -Inf | -Inf | -Inf |
| S/N | 25.7 | 44.5 | 49.4 |
| S/N(c) | 0.0 | 0.0 | 0.0 |
| SN(E/C) |
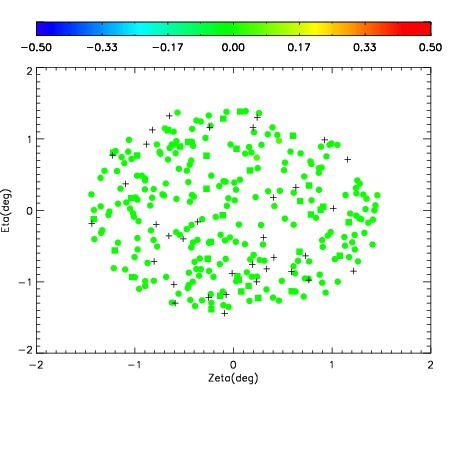
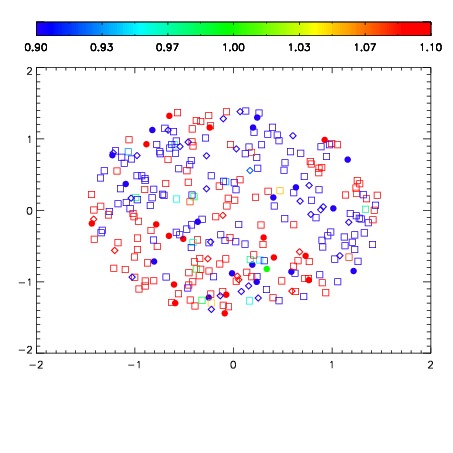
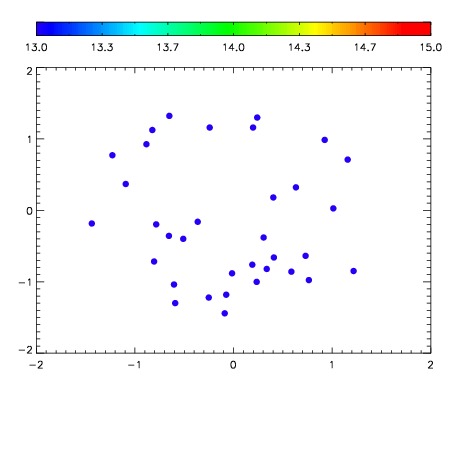

| Frame | Nreads | Zeropoints | Mag plots | Spatial mag deviation | Spatial sky 16325A emission deviations (filled: sky, open: star) | Spatial sky continuum emission | Spatial sky telluric CO2 absorption deviations (filled: H < 10) | |||||||||||||||||||||||
| 0 | 0 |
|
|
|
|
|
|
| IPAIR | NAME | SHIFT | NEWSHIFT | S/N | NAME | SHIFT | NEWSHIFT | S/N |
| 0 | 06420090 | 0.491666 | 0.00000 | 196.085 | 06420089 | 0.000714118 | 0.490952 | 203.487 |
| 1 | 06420087 | 0.484134 | 0.00753200 | 202.431 | 06420085 | 0.00000 | 0.491666 | 206.661 |
| 2 | 06420086 | 0.483883 | 0.00778300 | 194.021 | 06420092 | 0.00168768 | 0.489978 | 201.011 |
| 3 | 06420091 | 0.491566 | 9.99868e-05 | 181.871 | 06420088 | 0.00178657 | 0.489879 | 200.546 |