| Red | Green | Blue | |
| z | 17.64 | ||
| znorm | Inf | ||
| sky | -Inf | -Inf | -Inf |
| S/N | 24.5 | 43.3 | 48.2 |
| S/N(c) | 0.0 | 0.0 | 0.0 |
| SN(E/C) |
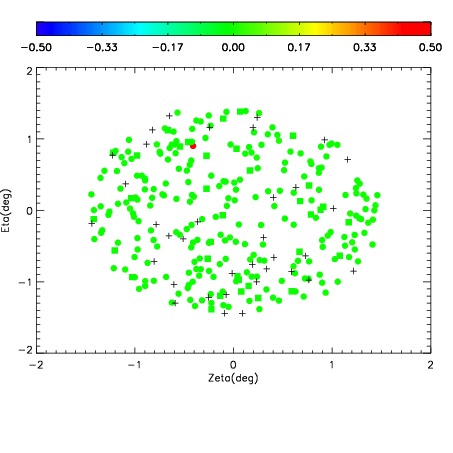
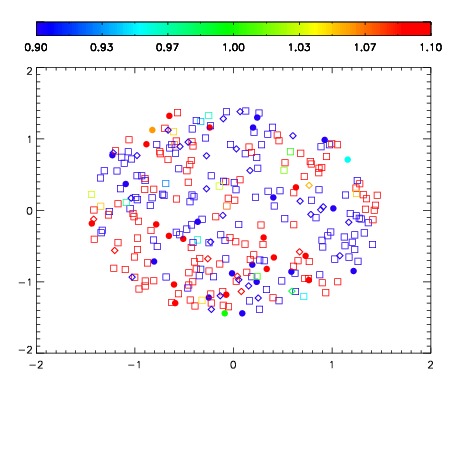
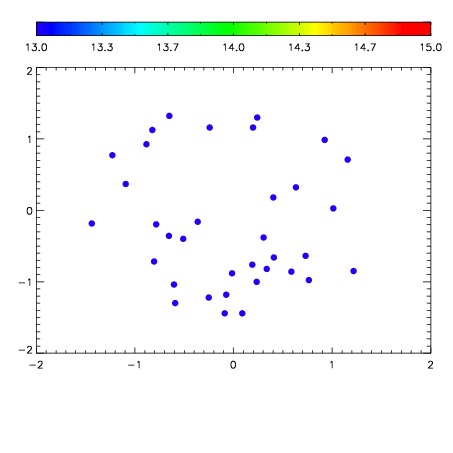

| Frame | Nreads | Zeropoints | Mag plots | Spatial mag deviation | Spatial sky 16325A emission deviations (filled: sky, open: star) | Spatial sky continuum emission | Spatial sky telluric CO2 absorption deviations (filled: H < 10) | |||||||||||||||||||||||
| 0 | 0 |
|
|
|
|
|
|
| IPAIR | NAME | SHIFT | NEWSHIFT | S/N | NAME | SHIFT | NEWSHIFT | S/N |
| 0 | 06670083 | 0.485467 | 0.00000 | 199.468 | 06670085 | 0.000824034 | 0.484643 | 187.149 |
| 1 | 06670087 | 0.484961 | 0.000505984 | 201.344 | 06670088 | -0.00206458 | 0.487532 | 206.672 |
| 2 | 06670086 | 0.483979 | 0.00148800 | 200.174 | 06670084 | 0.00220217 | 0.483265 | 191.527 |
| 3 | 06670082 | 0.484876 | 0.000590980 | 195.524 | 06670081 | 0.00000 | 0.485467 | 182.570 |