| Red | Green | Blue | |
| z | 17.64 | ||
| znorm | Inf | ||
| sky | -Inf | -Inf | -Inf |
| S/N | 25.4 | 43.7 | 56.0 |
| S/N(c) | 0.0 | 0.0 | 0.0 |
| SN(E/C) |
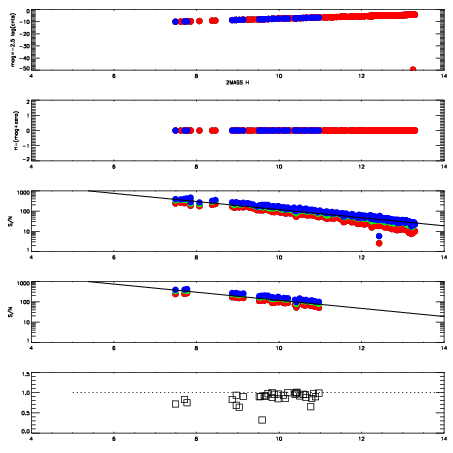
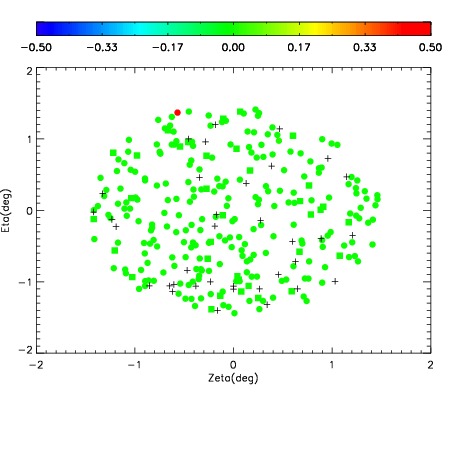
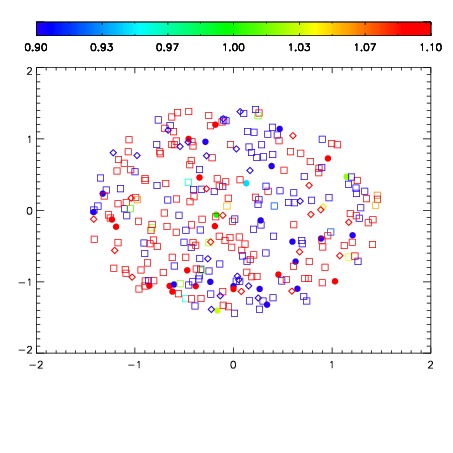
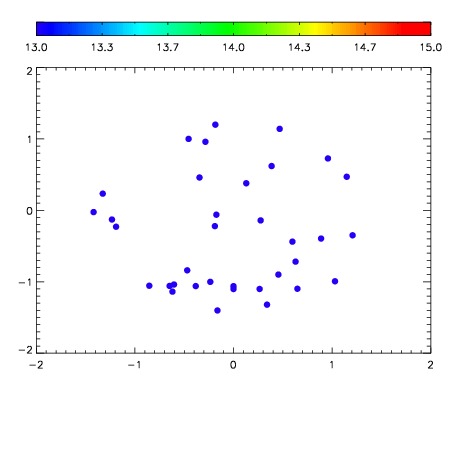

| Frame | Nreads | Zeropoints | Mag plots | Spatial mag deviation | Spatial sky 16325A emission deviations (filled: sky, open: star) | Spatial sky continuum emission | Spatial sky telluric CO2 absorption deviations (filled: H < 10) | |||||||||||||||||||||||
| 0 | 0 |
|
|
|
|
|
|
| IPAIR | NAME | SHIFT | NEWSHIFT | S/N | NAME | SHIFT | NEWSHIFT | S/N |
| 0 | 06430060 | 0.481777 | 0.00000 | 171.918 | 06430061 | 0.00409052 | 0.477686 | 166.905 |
| 1 | 06430064 | 0.481006 | 0.000771016 | 182.449 | 06430065 | 0.00133656 | 0.480440 | 180.803 |
| 2 | 06430063 | 0.481207 | 0.000569999 | 182.320 | 06430062 | 0.00410052 | 0.477676 | 173.655 |
| 3 | 06430059 | 0.481651 | 0.000126004 | 172.629 | 06430058 | 0.00000 | 0.481777 | 170.618 |