| Red | Green | Blue | |
| z | 17.64 | ||
| znorm | Inf | ||
| sky | -Inf | -Inf | -Inf |
| S/N | 26.9 | 42.8 | 50.7 |
| S/N(c) | 0.0 | 0.0 | 0.0 |
| SN(E/C) |
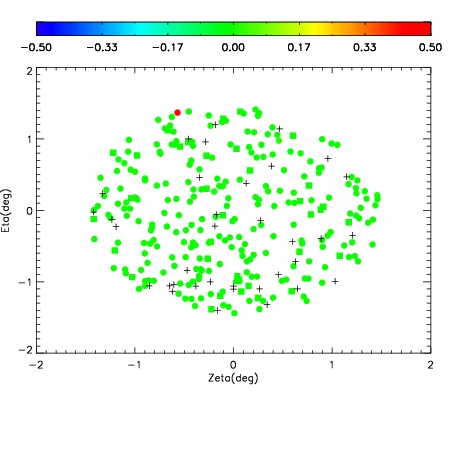
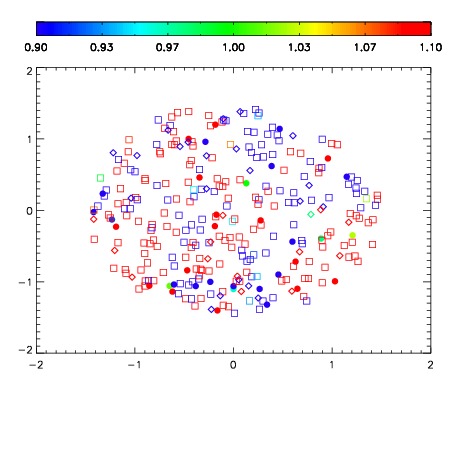
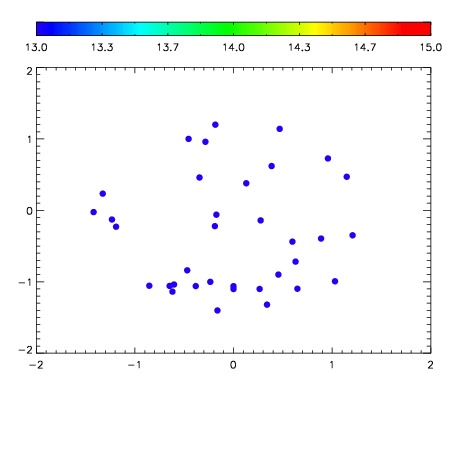

| Frame | Nreads | Zeropoints | Mag plots | Spatial mag deviation | Spatial sky 16325A emission deviations (filled: sky, open: star) | Spatial sky continuum emission | Spatial sky telluric CO2 absorption deviations (filled: H < 10) | |||||||||||||||||||||||
| 0 | 0 |
|
|
|
|
|
|
| IPAIR | NAME | SHIFT | NEWSHIFT | S/N | NAME | SHIFT | NEWSHIFT | S/N |
| 0 | 06690079 | 0.477746 | 0.00000 | 169.133 | 06690073 | 0.00000 | 0.477746 | 169.255 |
| 1 | 06690075 | 0.477402 | 0.000344008 | 177.942 | 06690077 | -0.000257011 | 0.478003 | 176.238 |
| 2 | 06690078 | 0.477302 | 0.000443995 | 176.962 | 06690076 | -0.00499565 | 0.482742 | 174.875 |
| 3 | 06690074 | 0.477138 | 0.000607997 | 168.482 | 06690080 | 0.00262965 | 0.475116 | 167.002 |