| Red | Green | Blue | |
| z | 17.64 | ||
| znorm | Inf | ||
| sky | -Inf | -Inf | -Inf |
| S/N | 23.9 | 40.5 | 50.7 |
| S/N(c) | 0.0 | 0.0 | 0.0 |
| SN(E/C) |
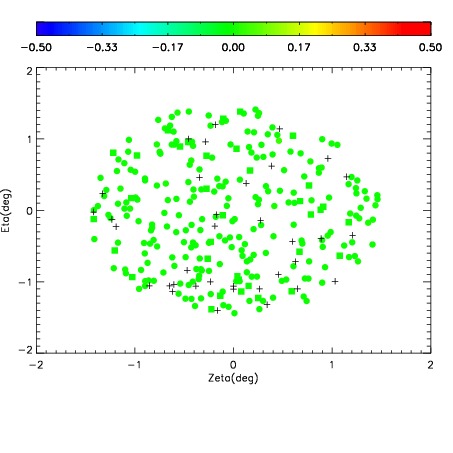
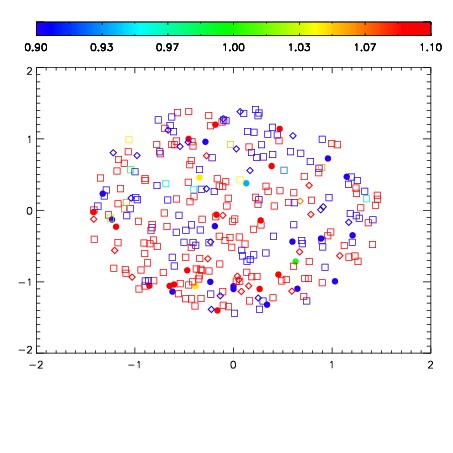
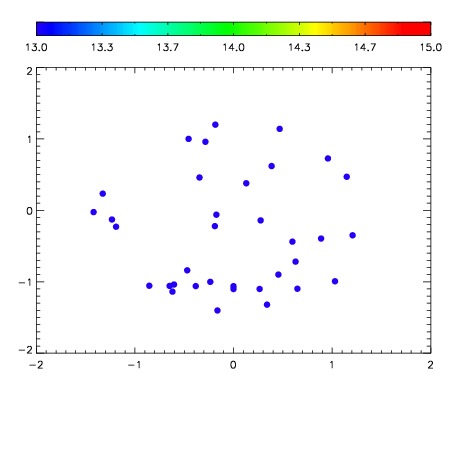

| Frame | Nreads | Zeropoints | Mag plots | Spatial mag deviation | Spatial sky 16325A emission deviations (filled: sky, open: star) | Spatial sky continuum emission | Spatial sky telluric CO2 absorption deviations (filled: H < 10) | |||||||||||||||||||||||
| 0 | 0 |
|
|
|
|
|
|
| IPAIR | NAME | SHIFT | NEWSHIFT | S/N | NAME | SHIFT | NEWSHIFT | S/N |
| 0 | 06740049 | 0.491384 | 0.00000 | 177.299 | 06740047 | 0.00000 | 0.491384 | 171.952 |
| 1 | 06740052 | 0.486845 | 0.00453901 | 192.217 | 06740051 | 0.000625699 | 0.490758 | 193.334 |
| 2 | 06740053 | 0.487781 | 0.00360301 | 191.932 | 06740054 | 0.00283560 | 0.488548 | 181.889 |
| 3 | 06740048 | 0.489837 | 0.00154701 | 177.904 | 06740050 | 0.00367432 | 0.487710 | 177.993 |