| Red | Green | Blue | |
| z | 17.64 | ||
| znorm | Inf | ||
| sky | -Inf | -Inf | -Inf |
| S/N | 28.9 | 48.3 | 55.0 |
| S/N(c) | 0.0 | 0.0 | 0.0 |
| SN(E/C) |
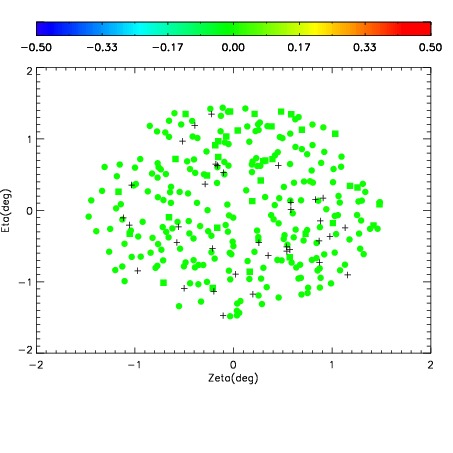
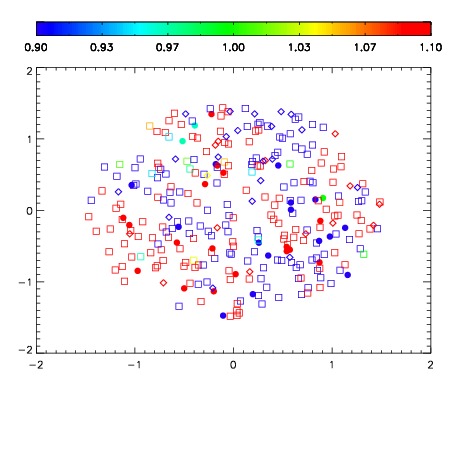
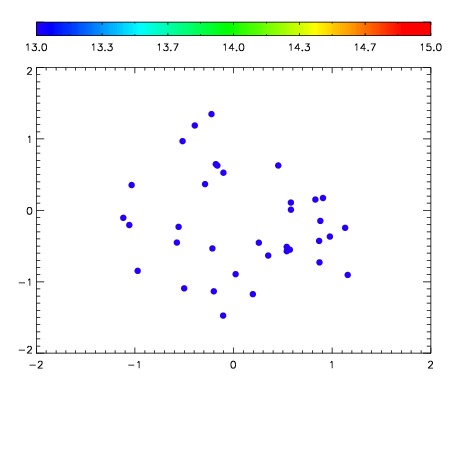

| Frame | Nreads | Zeropoints | Mag plots | Spatial mag deviation | Spatial sky 16325A emission deviations (filled: sky, open: star) | Spatial sky continuum emission | Spatial sky telluric CO2 absorption deviations (filled: H < 10) | |||||||||||||||||||||||
| 0 | 0 |
|
|
|
|
|
|
| IPAIR | NAME | SHIFT | NEWSHIFT | S/N | NAME | SHIFT | NEWSHIFT | S/N |
| 0 | 06400076 | 0.489048 | 0.00000 | 210.396 | 06400075 | 0.00000 | 0.489048 | 220.884 |
| 1 | 06400081 | 0.488558 | 0.000490010 | 221.482 | 06400082 | 0.000444552 | 0.488603 | 225.959 |
| 2 | 06400080 | 0.488501 | 0.000546992 | 221.294 | 06400079 | -9.65641e-05 | 0.489145 | 225.490 |
| 3 | 06400077 | 0.489039 | 9.00030e-06 | 221.049 | 06400078 | 0.00170125 | 0.487347 | 220.985 |