| Red | Green | Blue | |
| z | 17.64 | ||
| znorm | Inf | ||
| sky | -NaN | -Inf | -Inf |
| S/N | 28.7 | 49.2 | 55.7 |
| S/N(c) | 0.0 | 0.0 | 0.0 |
| SN(E/C) |
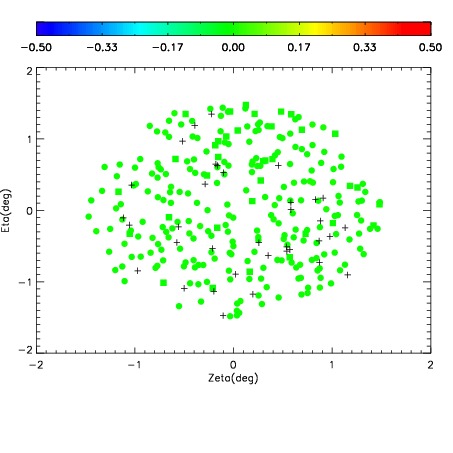
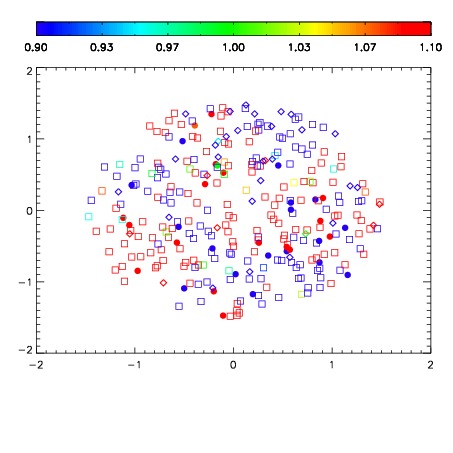
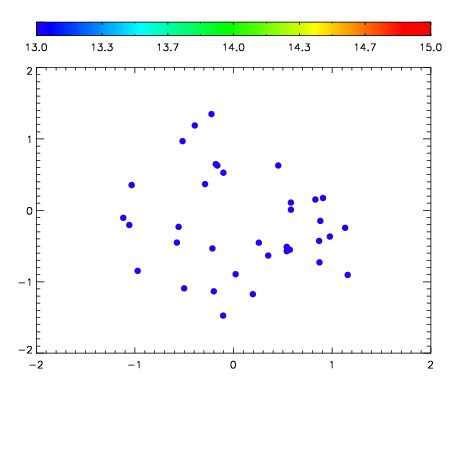

| Frame | Nreads | Zeropoints | Mag plots | Spatial mag deviation | Spatial sky 16325A emission deviations (filled: sky, open: star) | Spatial sky continuum emission | Spatial sky telluric CO2 absorption deviations (filled: H < 10) | |||||||||||||||||||||||
| 0 | 0 |
|
|
|
|
|
|
| IPAIR | NAME | SHIFT | NEWSHIFT | S/N | NAME | SHIFT | NEWSHIFT | S/N |
| 0 | 06440065 | 0.470163 | 0.00000 | 196.005 | 06440066 | 0.000423982 | 0.469739 | 200.603 |
| 1 | 06440060 | 0.468731 | 0.00143200 | 212.794 | 06440059 | 0.00000 | 0.470163 | 211.607 |
| 2 | 06440061 | 0.469965 | 0.000197977 | 210.705 | 06440062 | -0.00115258 | 0.471316 | 210.481 |
| 3 | 06440064 | 0.469977 | 0.000185996 | 172.521 | 06440063 | -0.00255612 | 0.472719 | 176.826 |