| Red | Green | Blue | |
| z | 17.64 | ||
| znorm | Inf | ||
| sky | -Inf | -Inf | -Inf |
| S/N | 28.5 | 46.8 | 56.6 |
| S/N(c) | 0.0 | 0.0 | 0.0 |
| SN(E/C) |

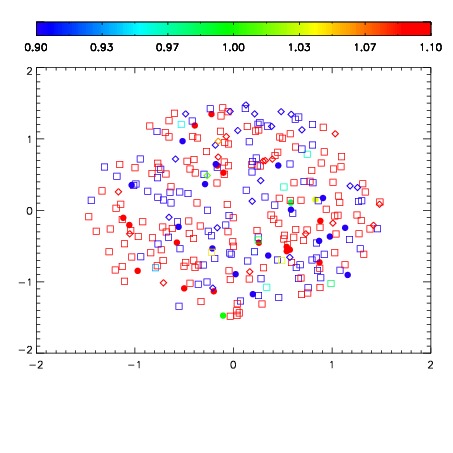
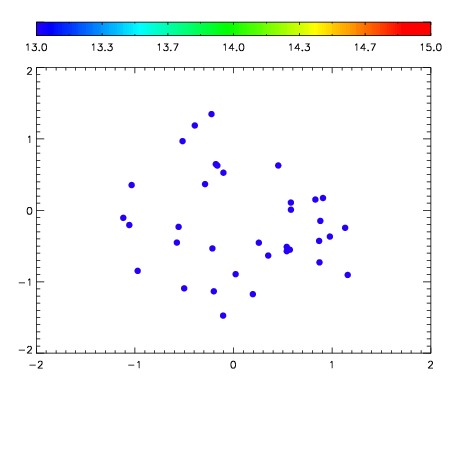

| Frame | Nreads | Zeropoints | Mag plots | Spatial mag deviation | Spatial sky 16325A emission deviations (filled: sky, open: star) | Spatial sky continuum emission | Spatial sky telluric CO2 absorption deviations (filled: H < 10) | |||||||||||||||||||||||
| 0 | 0 |
|
|
|
|
|
|
| IPAIR | NAME | SHIFT | NEWSHIFT | S/N | NAME | SHIFT | NEWSHIFT | S/N |
| 0 | 06660073 | 0.489998 | 0.00000 | 208.049 | 06660067 | 0.00000 | 0.489998 | 205.836 |
| 1 | 06660072 | 0.489750 | 0.000248015 | 213.276 | 06660071 | 0.000891202 | 0.489107 | 216.933 |
| 2 | 06660068 | 0.488554 | 0.00144401 | 209.363 | 06660074 | 0.00552934 | 0.484469 | 209.246 |
| 3 | 06660069 | 0.488536 | 0.00146201 | 207.069 | 06660070 | 0.00547358 | 0.484524 | 205.116 |