| Red | Green | Blue | |
| z | 17.64 | ||
| znorm | Inf | ||
| sky | -NaN | -Inf | -Inf |
| S/N | 28.8 | 48.5 | 53.4 |
| S/N(c) | 0.0 | 0.0 | 0.0 |
| SN(E/C) |
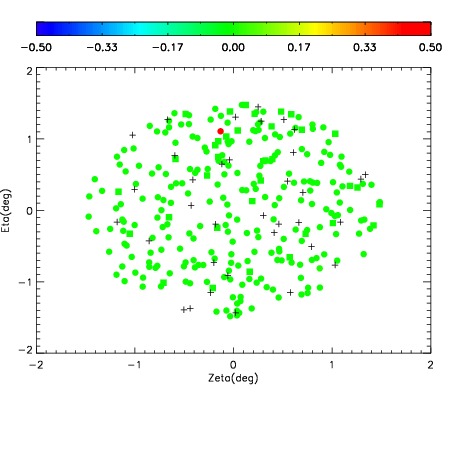
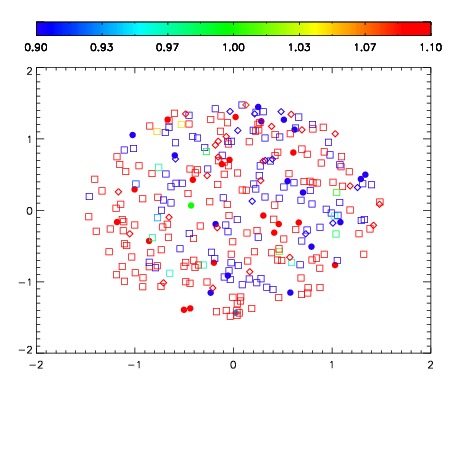
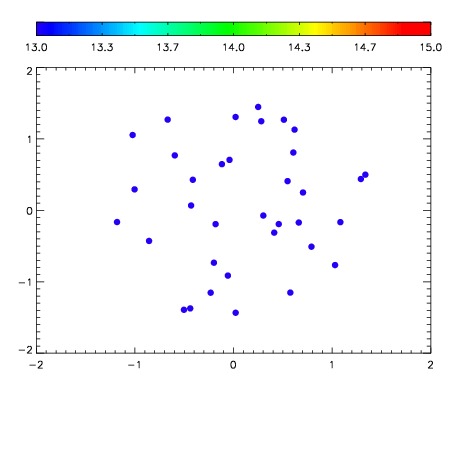

| Frame | Nreads | Zeropoints | Mag plots | Spatial mag deviation | Spatial sky 16325A emission deviations (filled: sky, open: star) | Spatial sky continuum emission | Spatial sky telluric CO2 absorption deviations (filled: H < 10) | |||||||||||||||||||||||
| 0 | 0 |
|
|
|
|
|
|
| IPAIR | NAME | SHIFT | NEWSHIFT | S/N | NAME | SHIFT | NEWSHIFT | S/N |
| 0 | 06650087 | 0.484132 | 0.00000 | 199.366 | 06650088 | 0.000582541 | 0.483549 | 197.901 |
| 1 | 06650086 | 0.483468 | 0.000663996 | 196.725 | 06650081 | 0.00000 | 0.484132 | 190.622 |
| 2 | 06650083 | 0.481755 | 0.00237700 | 190.653 | 06650085 | 0.00167405 | 0.482458 | 187.389 |
| 3 | 06650082 | 0.480818 | 0.00331399 | 189.090 | 06650084 | 0.000720975 | 0.483411 | 185.693 |