| Red | Green | Blue | |
| z | 17.64 | ||
| znorm | Inf | ||
| sky | -NaN | -Inf | -Inf |
| S/N | 26.8 | 46.5 | 48.5 |
| S/N(c) | 0.0 | 0.0 | 0.0 |
| SN(E/C) |
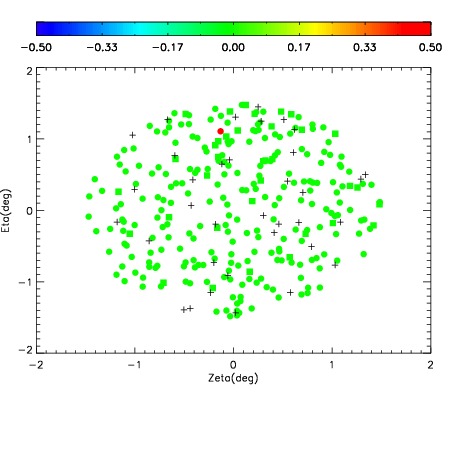
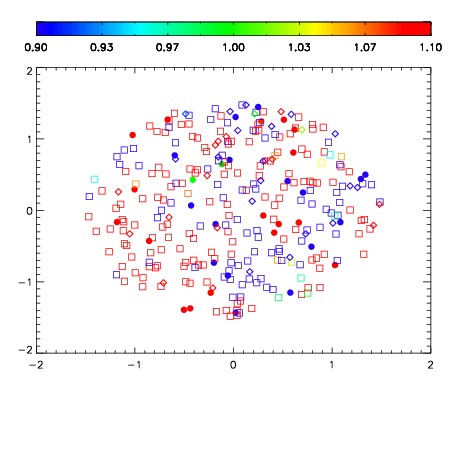
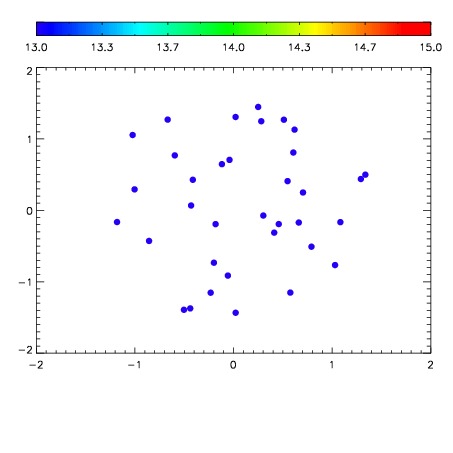

| Frame | Nreads | Zeropoints | Mag plots | Spatial mag deviation | Spatial sky 16325A emission deviations (filled: sky, open: star) | Spatial sky continuum emission | Spatial sky telluric CO2 absorption deviations (filled: H < 10) | |||||||||||||||||||||||
| 0 | 0 |
|
|
|
|
|
|
| IPAIR | NAME | SHIFT | NEWSHIFT | S/N | NAME | SHIFT | NEWSHIFT | S/N |
| 0 | 06690068 | 0.476840 | 0.00000 | 155.045 | 06690062 | 0.00000 | 0.476840 | 148.053 |
| 1 | 06690063 | 0.475807 | 0.00103298 | 156.677 | 06690069 | 0.000871668 | 0.475968 | 156.538 |
| 2 | 06690064 | 0.476371 | 0.000468999 | 152.561 | 06690065 | 0.000395274 | 0.476445 | 147.465 |
| 3 | 06690067 | 0.476525 | 0.000314981 | 149.403 | 06690066 | 0.00234198 | 0.474498 | 145.977 |