| Red | Green | Blue | |
| z | 17.64 | ||
| znorm | Inf | ||
| sky | -Inf | -Inf | -Inf |
| S/N | 24.8 | 42.6 | 45.9 |
| S/N(c) | 0.0 | 0.0 | 0.0 |
| SN(E/C) |
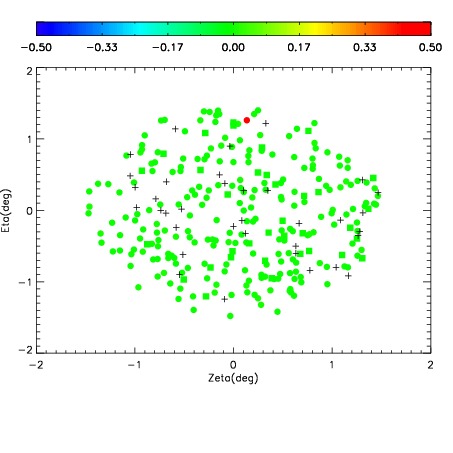
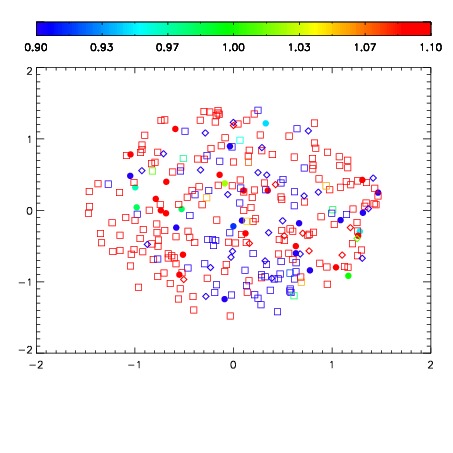
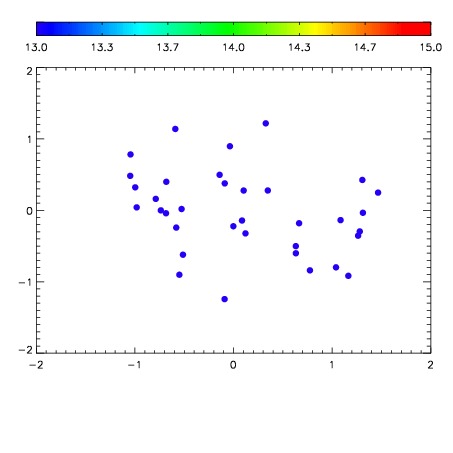

| Frame | Nreads | Zeropoints | Mag plots | Spatial mag deviation | Spatial sky 16325A emission deviations (filled: sky, open: star) | Spatial sky continuum emission | Spatial sky telluric CO2 absorption deviations (filled: H < 10) | |||||||||||||||||||||||
| 0 | 0 |
|
|
|
|
|
|
| IPAIR | NAME | SHIFT | NEWSHIFT | S/N | NAME | SHIFT | NEWSHIFT | S/N |
| 0 | 06740038 | 0.492189 | 0.00000 | 227.349 | 06740043 | 0.00194580 | 0.490243 | 229.416 |
| 1 | 06740042 | 0.491563 | 0.000625998 | 220.437 | 06740039 | 0.000736055 | 0.491453 | 214.285 |
| 2 | 06740037 | 0.491318 | 0.000871003 | 214.412 | 06740036 | 0.00000 | 0.492189 | 209.113 |
| 3 | 06740041 | 0.491125 | 0.00106400 | 210.565 | 06740040 | 0.000277482 | 0.491912 | 196.748 |