| Red | Green | Blue | |
| z | 17.64 | ||
| znorm | Inf | ||
| sky | -Inf | -Inf | -Inf |
| S/N | 21.2 | 38.2 | 43.5 |
| S/N(c) | 0.0 | 0.0 | 0.0 |
| SN(E/C) |
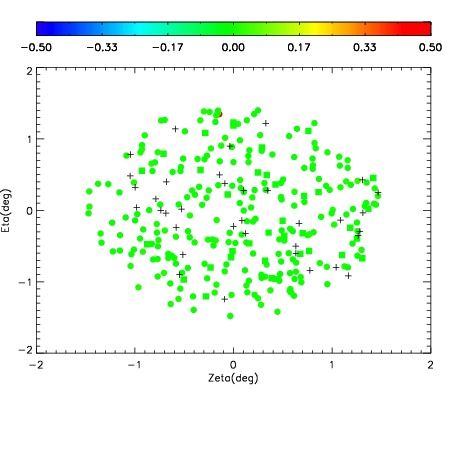
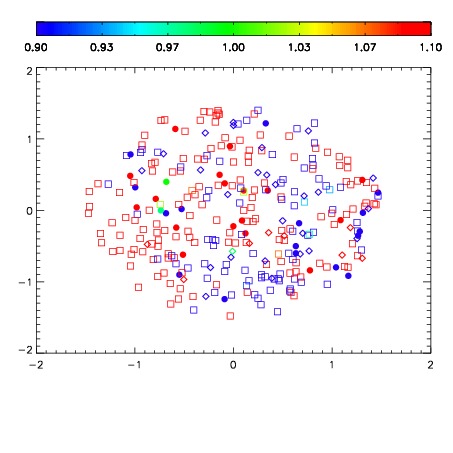
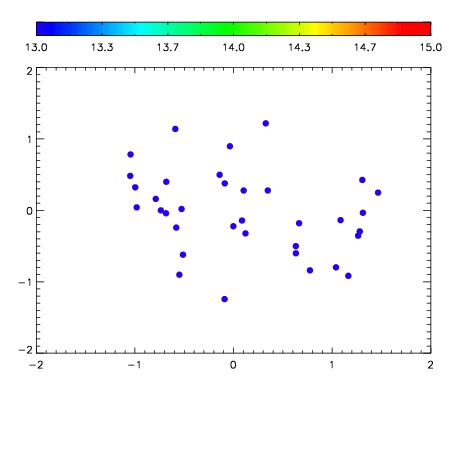

| Frame | Nreads | Zeropoints | Mag plots | Spatial mag deviation | Spatial sky 16325A emission deviations (filled: sky, open: star) | Spatial sky continuum emission | Spatial sky telluric CO2 absorption deviations (filled: H < 10) | |||||||||||||||||||||||
| 0 | 0 |
|
|
|
|
|
|
| IPAIR | NAME | SHIFT | NEWSHIFT | S/N | NAME | SHIFT | NEWSHIFT | S/N |
| 0 | 06920065 | 0.498604 | 0.00000 | 218.345 | 06920066 | 0.00199784 | 0.496606 | 199.797 |
| 1 | 06920064 | 0.497788 | 0.000815988 | 227.966 | 06920063 | 0.00000 | 0.498604 | 229.468 |
| 2 | 06920069 | 0.497437 | 0.00116700 | 199.084 | 06920070 | 0.00316188 | 0.495442 | 193.099 |
| 3 | 06920068 | 0.496860 | 0.00174400 | 173.158 | 06920067 | 0.00218143 | 0.496423 | 177.753 |