| Red | Green | Blue | |
| z | 17.64 | ||
| znorm | Inf | ||
| sky | -Inf | -Inf | -Inf |
| S/N | 30.0 | 51.5 | 54.5 |
| S/N(c) | 0.0 | 0.0 | 0.0 |
| SN(E/C) |
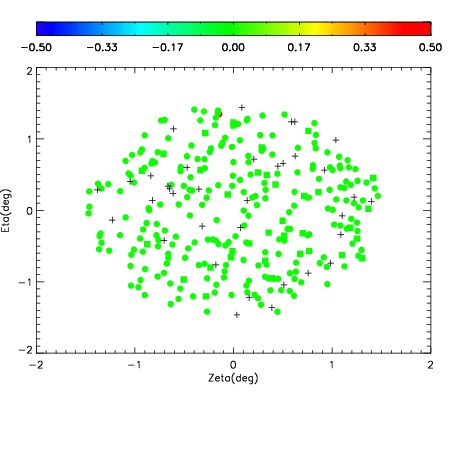
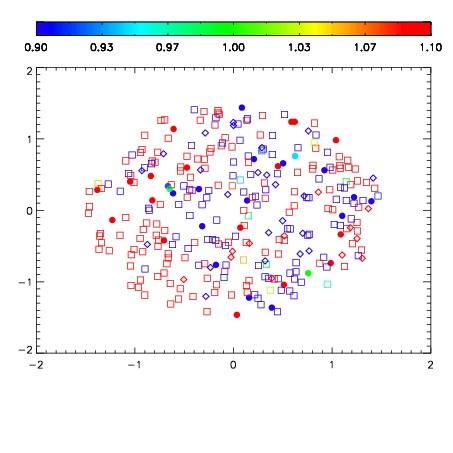
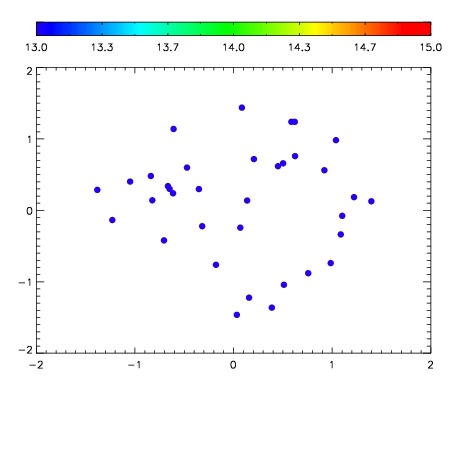

| Frame | Nreads | Zeropoints | Mag plots | Spatial mag deviation | Spatial sky 16325A emission deviations (filled: sky, open: star) | Spatial sky continuum emission | Spatial sky telluric CO2 absorption deviations (filled: H < 10) | |||||||||||||||||||||||
| 0 | 0 |
|
|
|
|
|
|
| IPAIR | NAME | SHIFT | NEWSHIFT | S/N | NAME | SHIFT | NEWSHIFT | S/N |
| 0 | 06750011 | 0.494613 | 0.00000 | 186.535 | 06750010 | 0.00000 | 0.494613 | 179.124 |
| 1 | 06750015 | 0.491733 | 0.00287998 | 194.217 | 06750014 | -0.000645305 | 0.495258 | 193.610 |
| 2 | 06750012 | 0.494490 | 0.000122994 | 192.803 | 06750017 | 0.00401479 | 0.490598 | 192.813 |
| 3 | 06750016 | 0.491753 | 0.00285998 | 189.696 | 06750013 | 0.00200632 | 0.492607 | 192.644 |