| Red | Green | Blue | |
| z | 17.64 | ||
| znorm | Inf | ||
| sky | -Inf | -Inf | -Inf |
| S/N | 32.6 | 55.6 | 60.0 |
| S/N(c) | 0.0 | 0.0 | 0.0 |
| SN(E/C) |

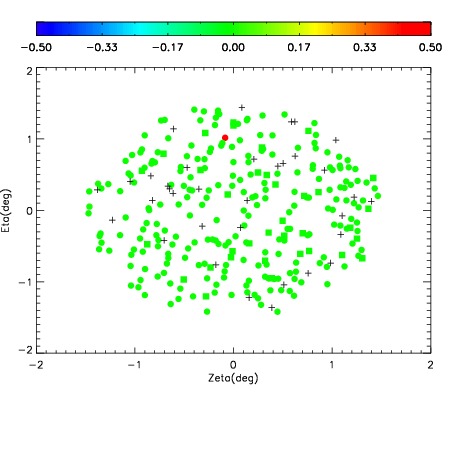
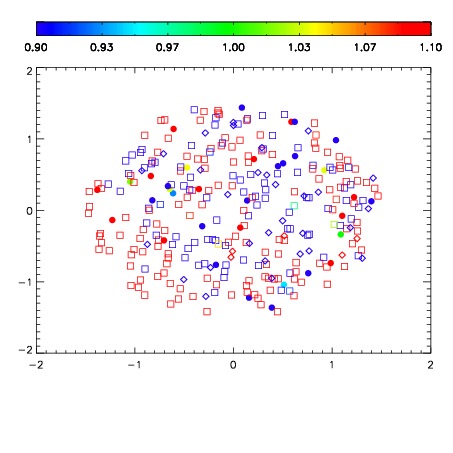
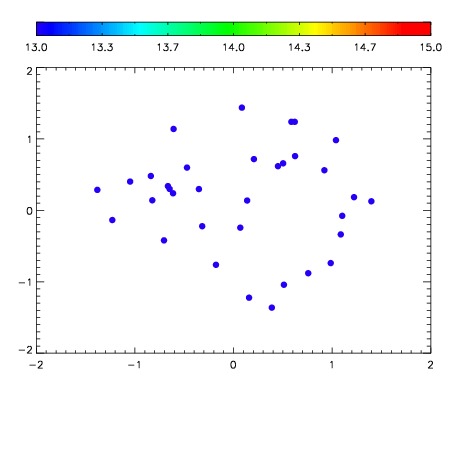

| Frame | Nreads | Zeropoints | Mag plots | Spatial mag deviation | Spatial sky 16325A emission deviations (filled: sky, open: star) | Spatial sky continuum emission | Spatial sky telluric CO2 absorption deviations (filled: H < 10) | |||||||||||||||||||||||
| 0 | 0 |
|
|
|
|
|
|
| IPAIR | NAME | SHIFT | NEWSHIFT | S/N | NAME | SHIFT | NEWSHIFT | S/N |
| 0 | 06930063 | 0.493424 | 0.00000 | 213.242 | 06930062 | 0.00000 | 0.493424 | 210.941 |
| 1 | 06930064 | 0.493037 | 0.000387013 | 216.548 | 06930065 | 0.00183067 | 0.491593 | 215.626 |
| 2 | 06930067 | 0.491463 | 0.00196099 | 215.669 | 06930066 | 0.00292445 | 0.490500 | 212.028 |
| 3 | 06930068 | 0.491670 | 0.00175399 | 210.823 | 06930069 | 0.000128044 | 0.493296 | 208.917 |