| Red | Green | Blue | |
| z | 17.64 | ||
| znorm | Inf | ||
| sky | -Inf | -NaN | -Inf |
| S/N | 28.6 | 45.2 | 47.6 |
| S/N(c) | 0.0 | 0.0 | 0.0 |
| SN(E/C) |
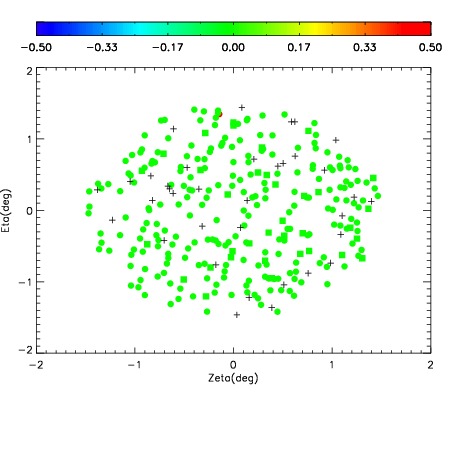
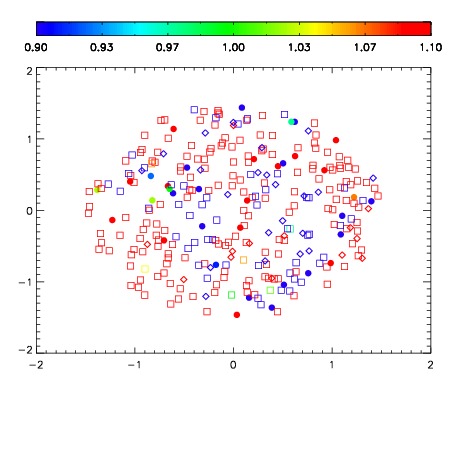
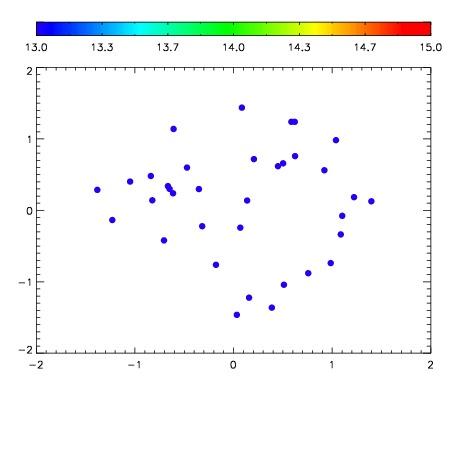

| Frame | Nreads | Zeropoints | Mag plots | Spatial mag deviation | Spatial sky 16325A emission deviations (filled: sky, open: star) | Spatial sky continuum emission | Spatial sky telluric CO2 absorption deviations (filled: H < 10) | |||||||||||||||||||||||
| 0 | 0 |
|
|
|
|
|
|
| IPAIR | NAME | SHIFT | NEWSHIFT | S/N | NAME | SHIFT | NEWSHIFT | S/N |
| 0 | 07020039 | 0.476943 | 0.00000 | 201.875 | 07020044 | 0.00702217 | 0.469921 | 195.542 |
| 1 | 07020038 | 0.474777 | 0.00216597 | 201.897 | 07020040 | 0.00189305 | 0.475050 | 200.204 |
| 2 | 07020042 | 0.474343 | 0.00259998 | 198.716 | 07020041 | 0.00731208 | 0.469631 | 193.920 |
| 3 | 07020043 | 0.474948 | 0.00199500 | 196.323 | 07020037 | 0.00000 | 0.476943 | 191.440 |