| Red | Green | Blue | |
| z | 17.64 | ||
| znorm | Inf | ||
| sky | -Inf | -Inf | -Inf |
| S/N | 18.5 | 35.6 | 39.8 |
| S/N(c) | 0.0 | 0.0 | 0.0 |
| SN(E/C) |

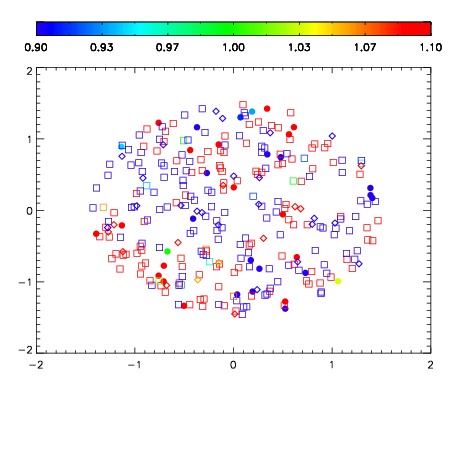
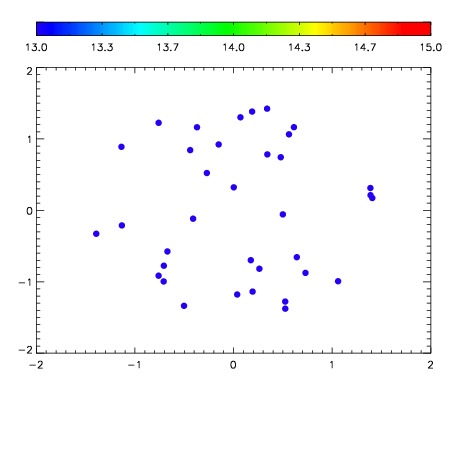

| Frame | Nreads | Zeropoints | Mag plots | Spatial mag deviation | Spatial sky 16325A emission deviations (filled: sky, open: star) | Spatial sky continuum emission | Spatial sky telluric CO2 absorption deviations (filled: H < 10) | |||||||||||||||||||||||
| 0 | 0 |
|
|
|
|
|
|
| IPAIR | NAME | SHIFT | NEWSHIFT | S/N | NAME | SHIFT | NEWSHIFT | S/N |
| 0 | 07040039 | 0.467836 | 0.00000 | 180.176 | 07040040 | -0.00197498 | 0.469811 | 180.749 |
| 1 | 07040042 | 0.465401 | 0.00243500 | 208.397 | 07040041 | -0.00140555 | 0.469242 | 202.655 |
| 2 | 07040043 | 0.465522 | 0.00231400 | 191.427 | 07040044 | 0.00143655 | 0.466399 | 192.467 |
| 3 | 07040038 | 0.467444 | 0.000391990 | 166.831 | 07040037 | 0.00000 | 0.467836 | 168.415 |