| Red | Green | Blue | |
| z | 17.64 | ||
| znorm | Inf | ||
| sky | -Inf | -Inf | -Inf |
| S/N | 25.2 | 44.7 | 48.7 |
| S/N(c) | 0.0 | 0.0 | 0.0 |
| SN(E/C) |
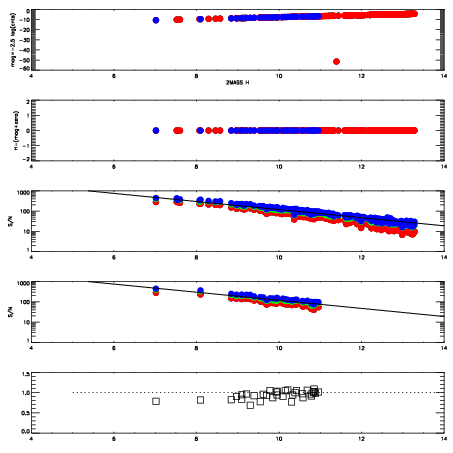
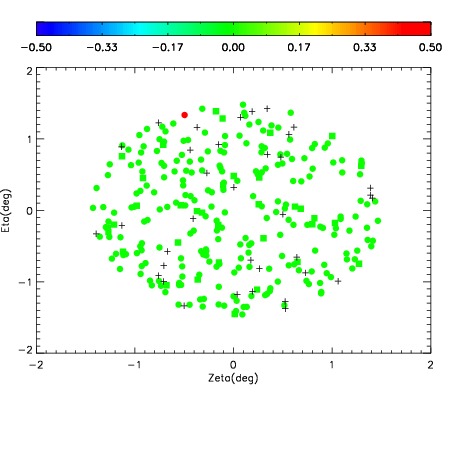
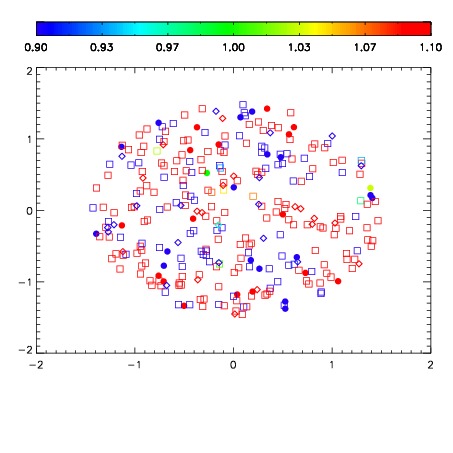
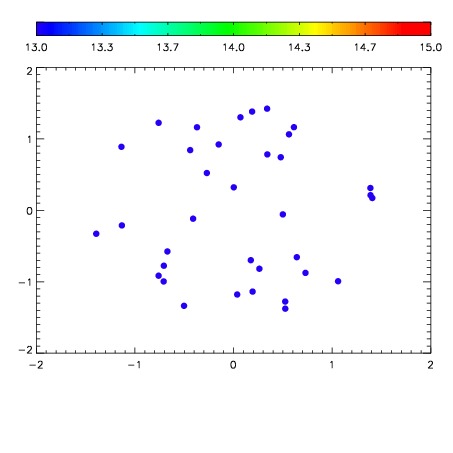

| Frame | Nreads | Zeropoints | Mag plots | Spatial mag deviation | Spatial sky 16325A emission deviations (filled: sky, open: star) | Spatial sky continuum emission | Spatial sky telluric CO2 absorption deviations (filled: H < 10) | |||||||||||||||||||||||
| 0 | 0 |
|
|
|
|
|
|
| IPAIR | NAME | SHIFT | NEWSHIFT | S/N | NAME | SHIFT | NEWSHIFT | S/N |
| 0 | 07890024 | 0.471186 | 0.00000 | 190.220 | 07890025 | -0.00206373 | 0.473250 | 174.493 |
| 1 | 07890028 | 0.470012 | 0.00117400 | 214.930 | 07890029 | -0.00377903 | 0.474965 | 216.375 |
| 2 | 07890023 | 0.471011 | 0.000174999 | 193.540 | 07890022 | 0.00000 | 0.471186 | 181.194 |
| 3 | 07890027 | 0.469185 | 0.00200102 | 187.183 | 07890026 | -0.00594614 | 0.477132 | 142.957 |