| Red | Green | Blue | |
| z | 17.64 | ||
| znorm | Inf | ||
| sky | -Inf | -Inf | -Inf |
| S/N | 25.3 | 43.4 | 46.7 |
| S/N(c) | 0.0 | 0.0 | 0.0 |
| SN(E/C) |
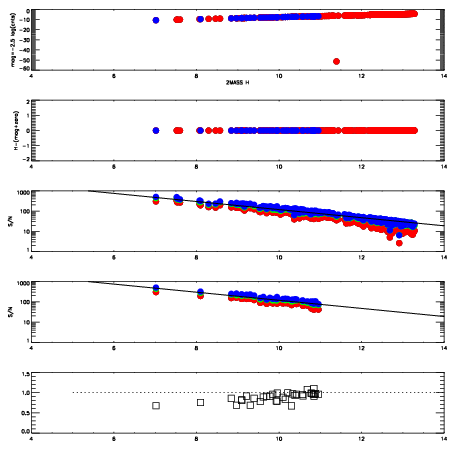

| Frame | Nreads | Zeropoints | Mag plots | Spatial mag deviation | Spatial sky 16325A emission deviations (filled: sky, open: star) | Spatial sky continuum emission | Spatial sky telluric CO2 absorption deviations (filled: H < 10) | |||||||||||||||||||||||
| 0 | 0 |
|
|
|
|
|
|
| IPAIR | NAME | SHIFT | NEWSHIFT | S/N | NAME | SHIFT | NEWSHIFT | S/N |
| 0 | 08150013 | 0.512787 | 0.00000 | 209.667 | 08150014 | -0.000541153 | 0.513328 | 183.819 |
| 1 | 08150017 | 0.509286 | 0.00350100 | 224.741 | 08150018 | -0.00200495 | 0.514792 | 228.963 |
| 2 | 08150012 | 0.509407 | 0.00338000 | 224.121 | 08150011 | 0.00000 | 0.512787 | 225.915 |
| 3 | 08150016 | 0.509774 | 0.00301296 | 217.502 | 08150015 | -0.00174334 | 0.514530 | 206.248 |