| Red | Green | Blue | |
| z | 17.64 | ||
| znorm | Inf | ||
| sky | -NaN | -Inf | -Inf |
| S/N | 28.3 | 48.7 | 51.8 |
| S/N(c) | 0.0 | 0.0 | 0.0 |
| SN(E/C) |
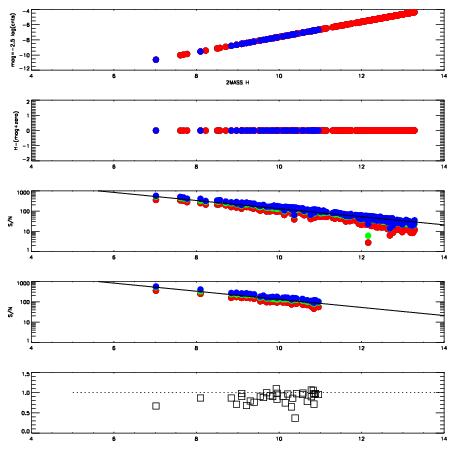
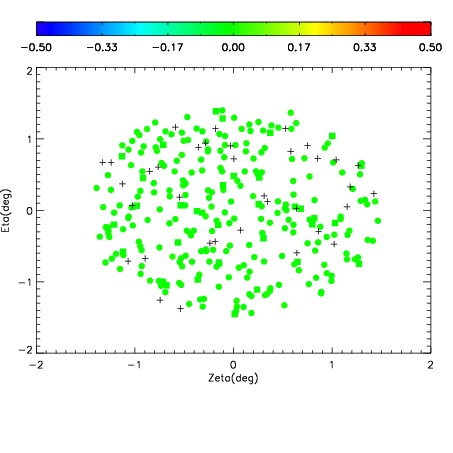

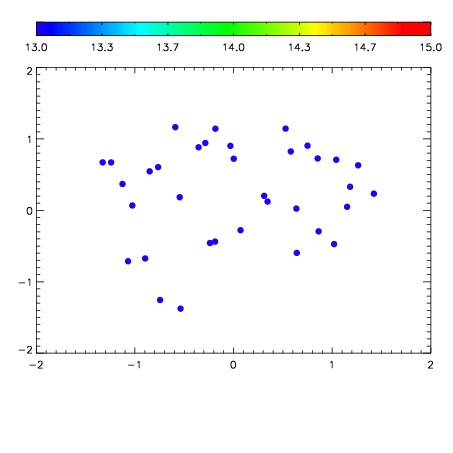

| Frame | Nreads | Zeropoints | Mag plots | Spatial mag deviation | Spatial sky 16325A emission deviations (filled: sky, open: star) | Spatial sky continuum emission | Spatial sky telluric CO2 absorption deviations (filled: H < 10) | |||||||||||||||||||||||
| 0 | 0 |
|
|
|
|
|
|
| IPAIR | NAME | SHIFT | NEWSHIFT | S/N | NAME | SHIFT | NEWSHIFT | S/N |
| 0 | 10800093 | 0.492052 | 0.00000 | 189.545 | 10800094 | -0.00157010 | 0.493622 | 199.897 |
| 1 | 10800088 | 0.491512 | 0.000539988 | 205.716 | 10800087 | 0.00000 | 0.492052 | 204.458 |
| 2 | 10800089 | 0.491783 | 0.000268996 | 203.661 | 10800090 | -0.000363912 | 0.492416 | 202.609 |
| 3 | 10800096 | 0.488766 | 0.00328597 | 200.558 | 10800095 | -0.00111773 | 0.493170 | 201.053 |
| 4 | 10800092 | 0.491787 | 0.000265002 | 186.504 | 10800091 | -0.000425576 | 0.492478 | 189.659 |