| Red | Green | Blue | |
| z | 17.64 | ||
| znorm | Inf | ||
| sky | -Inf | -Inf | -Inf |
| S/N | 27.4 | 48.9 | 55.2 |
| S/N(c) | 0.0 | 0.0 | 0.0 |
| SN(E/C) |
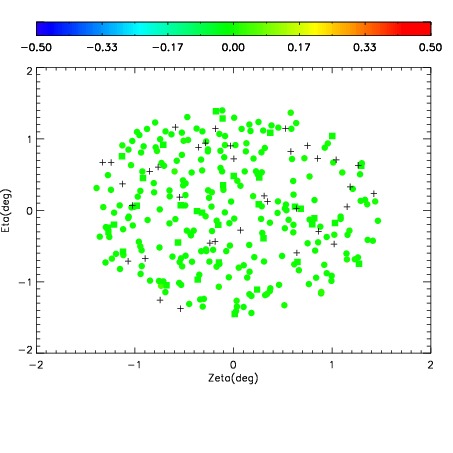
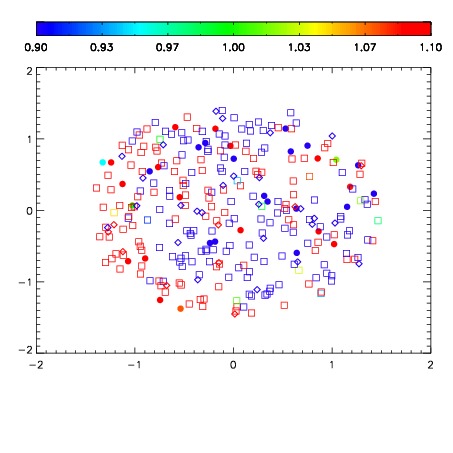
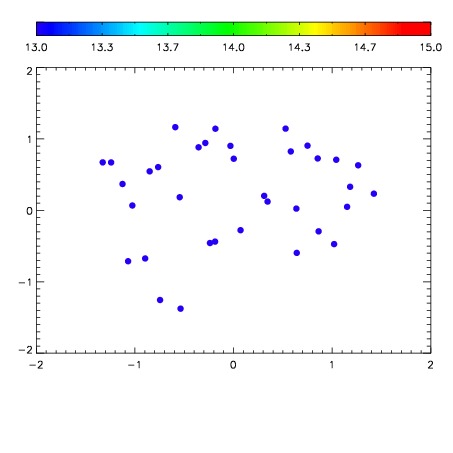

| Frame | Nreads | Zeropoints | Mag plots | Spatial mag deviation | Spatial sky 16325A emission deviations (filled: sky, open: star) | Spatial sky continuum emission | Spatial sky telluric CO2 absorption deviations (filled: H < 10) | |||||||||||||||||||||||
| 0 | 0 |
|
|
|
|
|
|
| IPAIR | NAME | SHIFT | NEWSHIFT | S/N | NAME | SHIFT | NEWSHIFT | S/N |
| 0 | 10880074 | 0.503176 | 0.00000 | 224.796 | 10880072 | -0.00159250 | 0.504768 | 213.225 |
| 1 | 10880071 | 0.502165 | 0.00101095 | 229.030 | 10880069 | 0.00000 | 0.503176 | 226.912 |
| 2 | 10880075 | 0.502897 | 0.000278950 | 228.574 | 10880076 | -0.00244373 | 0.505620 | 225.384 |
| 3 | 10880070 | 0.501697 | 0.00147897 | 225.275 | 10880073 | -0.00158608 | 0.504762 | 213.926 |