| Red | Green | Blue | |
| z | 17.64 | ||
| znorm | Inf | ||
| sky | -Inf | -Inf | -Inf |
| S/N | 28.5 | 49.0 | 54.1 |
| S/N(c) | 0.0 | 0.0 | 0.0 |
| SN(E/C) |
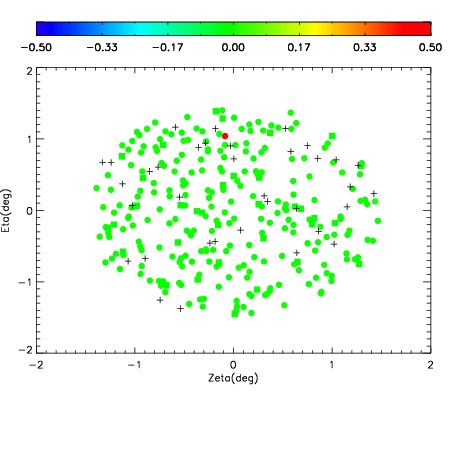
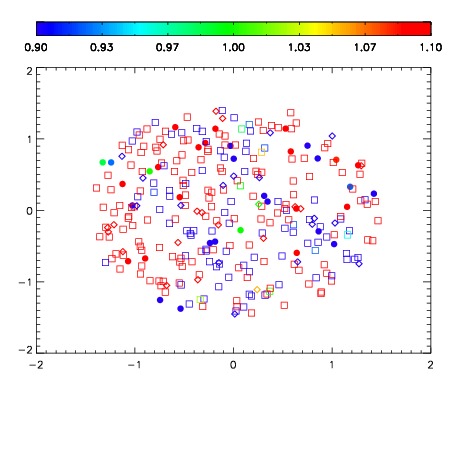
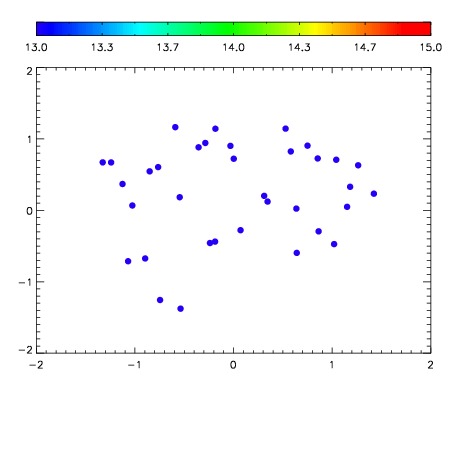

| Frame | Nreads | Zeropoints | Mag plots | Spatial mag deviation | Spatial sky 16325A emission deviations (filled: sky, open: star) | Spatial sky continuum emission | Spatial sky telluric CO2 absorption deviations (filled: H < 10) | |||||||||||||||||||||||
| 0 | 0 |
|
|
|
|
|
|
| IPAIR | NAME | SHIFT | NEWSHIFT | S/N | NAME | SHIFT | NEWSHIFT | S/N |
| 0 | 11070054 | 0.483309 | 0.00000 | 201.034 | 11070055 | 0.00457666 | 0.478732 | 202.604 |
| 1 | 11070050 | 0.482798 | 0.000510991 | 214.186 | 11070051 | 0.00329992 | 0.480009 | 214.233 |
| 2 | 11070049 | 0.482235 | 0.00107399 | 212.772 | 11070048 | 0.00000 | 0.483309 | 213.364 |
| 3 | 11070053 | 0.482370 | 0.000939012 | 205.265 | 11070052 | 0.00335931 | 0.479950 | 210.808 |