| Red | Green | Blue | |
| z | 17.64 | ||
| znorm | Inf | ||
| sky | -NaN | -Inf | -Inf |
| S/N | 30.5 | 52.2 | 58.3 |
| S/N(c) | 0.0 | 0.0 | 0.0 |
| SN(E/C) |
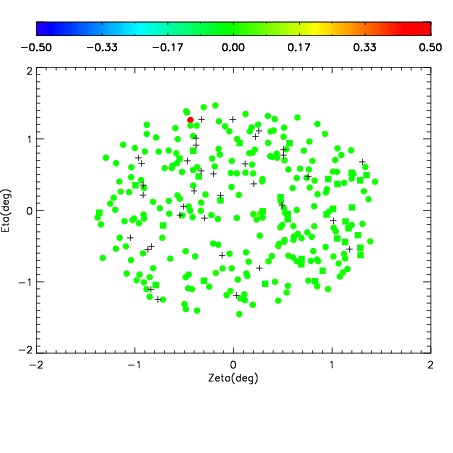
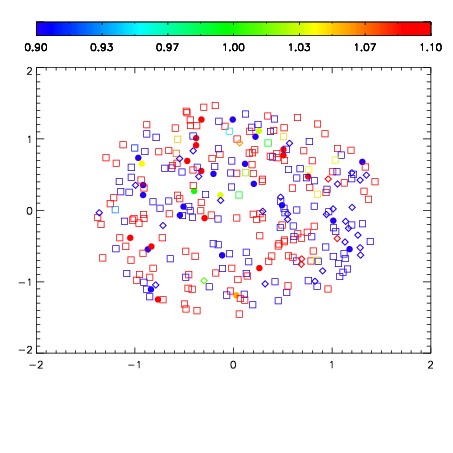


| Frame | Nreads | Zeropoints | Mag plots | Spatial mag deviation | Spatial sky 16325A emission deviations (filled: sky, open: star) | Spatial sky continuum emission | Spatial sky telluric CO2 absorption deviations (filled: H < 10) | |||||||||||||||||||||||
| 0 | 0 |
|
|
|
|
|
|
| IPAIR | NAME | SHIFT | NEWSHIFT | S/N | NAME | SHIFT | NEWSHIFT | S/N |
| 0 | 06730050 | 0.496186 | 0.00000 | 219.774 | 06730051 | 0.00164274 | 0.494543 | 222.307 |
| 1 | 06730054 | 0.494064 | 0.00212198 | 232.473 | 06730055 | 0.00200408 | 0.494182 | 231.253 |
| 2 | 06730053 | 0.491928 | 0.00425798 | 229.369 | 06730048 | 0.00000 | 0.496186 | 226.034 |
| 3 | 06730049 | 0.494828 | 0.00135800 | 221.723 | 06730052 | 0.00403531 | 0.492151 | 224.501 |